
For many of us, draft season is a lot like waiting until the night before an exam to start studying. Between mock drafts, big boards, and podcasts, there is a lot of information to take in in a short amount of time between the end of the Super Bowl and the last week of April. The NFL Combine is an important step along the way of our cram session. This week, a total of 321 prospects will all gather in Indianapolis and most will participate in combine events such as the forty-yard dash, three cone drill, and more.
For certain positions, there are events that happen that may be more important than others; Kevin Cole of Unexpected Points and others have produced research on the topic. In this article we will be looking at two things using all players who have attended the NFL combine since 2016:
- How well combine metrics predict production in the NFL. This is done by taking the combine events plus information about a player (age, height, and weight) and mapping it to a production stat. A correlation coefficient is determined for each pairing.
- How impactful combine metrics are on draft position. Using the Fitzgerald-Spielberger pick value chart to determine how valuable the picks are, we can start to see what influences players to be selected based on how they stack up at the combine. A correlation coefficient is also determined for each.
For information like forty time, shuttle time, and three cone time, the correlation coefficients are flipped to show that a lower forty time is better and thus positively correlates with production and/or draft value. It should be noted that are a couple of key caveats to this analysis:
- Since this analysis is just focused on what we should be taking away from the NFL Combine, this is no information on how the player did at their pro day or when they tested elsewhere. Some schools are seen as having faster forty times on average, but the combine hopefully gives a relatively even playing field.
- There is some selection bias in this analysis as players who are likely to be top picks might only participate in the events that they feel comfortable in.
- We aren’t using a catch-all metric like Win Contributions for this analysis so it was discretionary to pick which production stats would be used.
- While teams almost certainly consider all data points in their player evaluations, the use of the word “consider” in this article is meant to highlight the correlation of combine information and draft value.
- While age is not something that gets measured at the combine, it is included to give context to some of the selection biases and confounding variables that can occur in this analysis.
With all of that being said, let’s take a look at the offensive positions and what influences production and draft position.
Quarterback

When mapping each of the combine data points to a quarterback’s total EPA per season, we can see that broad jump is the combine measurement to watch while age, three cone, and weight influence a quarterback’s production as well.

When it comes to broad jump, there is a positive correlation as some of the better quarterbacks in the league did well in broad jump like Justin Herbert and Jalen Hurts. There also does appear to be a cutoff at around 110 inches where no one under that has been a long-term productive starter since 2016.

When it comes to draft position, age is a factor for teams as the median age for quarterbacks taken in the 1st round is 21.8 while the median age after the 1st round is 23.1. When it comes to combine events specifically, three cone and broad jump are understood by teams as being important while they place much less weight on shuttle and vertical jump.
Running Back

For running backs, when mapping their data points to their total yards per season, we can see that age and weight are very important factors while the actual combine events themselves hold less predictive power. Forty-yard dash is the one of note here as that carries the least weight.

There is a positive correlation between a running back’s weight and their production in the NFL. Some lighter running backs have struggled to stay healthy while heavier running backs like Derrick Henry, Nick Chubb, and Jonathan Taylor push to shoulder a full workload throughout the season.

When looking at which factors teams consider, they do correctly feature age and weight at the top, but probably overvalue forty-yard dash as that doesn’t appear to have much of a relationship with NFL success.
Wide Receiver

When we look at how well wide receiver data points correlate with total yards per season in the NFL, age again shows up as an important factor. Vertical jump ends up as the most important combine event for receivers and forty time is something that doesn’t hold as much weight as most might expect.

However, teams do still appear to overvalue receivers that run the forty-yard dash quickly. In their draft decision making they do appear to correctly pick up on broad jump and vertical jump mattering.

We can see that how much draft capital is spent on a receiver and their forty-yard dash time is correlated. This has led towards players like John Ross and Tyquan Thornton perhaps being over drafted. As college tracking data becomes more available and used, forty-yard dash time could decrease in its correlation with draft value as a player’s average speed in games could play a bigger role in decision making.
Tight End

Tight end is the offensive position where the combine plays a big role in their receiving production in the NFL. It should be noted there is no measure of blocking ability here and instead just their total receiving yards per season. Forty time, broad jump, vertical jump, and three cone drill are all strongly positively correlated while weight is negatively correlated.

Some of the league’s productive tight ends drafted since 2016 like George Kittle, Evan Engram, and Noah Fant all ran fast forty-yard dashes relative to tight ends. Running a forty over 4.7 has only led to a handful of productive tight ends.

Teams are considering all of this when they draft tight ends. Forty is the main correlated feature that they consider while broad jump, shuttle, and three cone are all heavily considered as well.
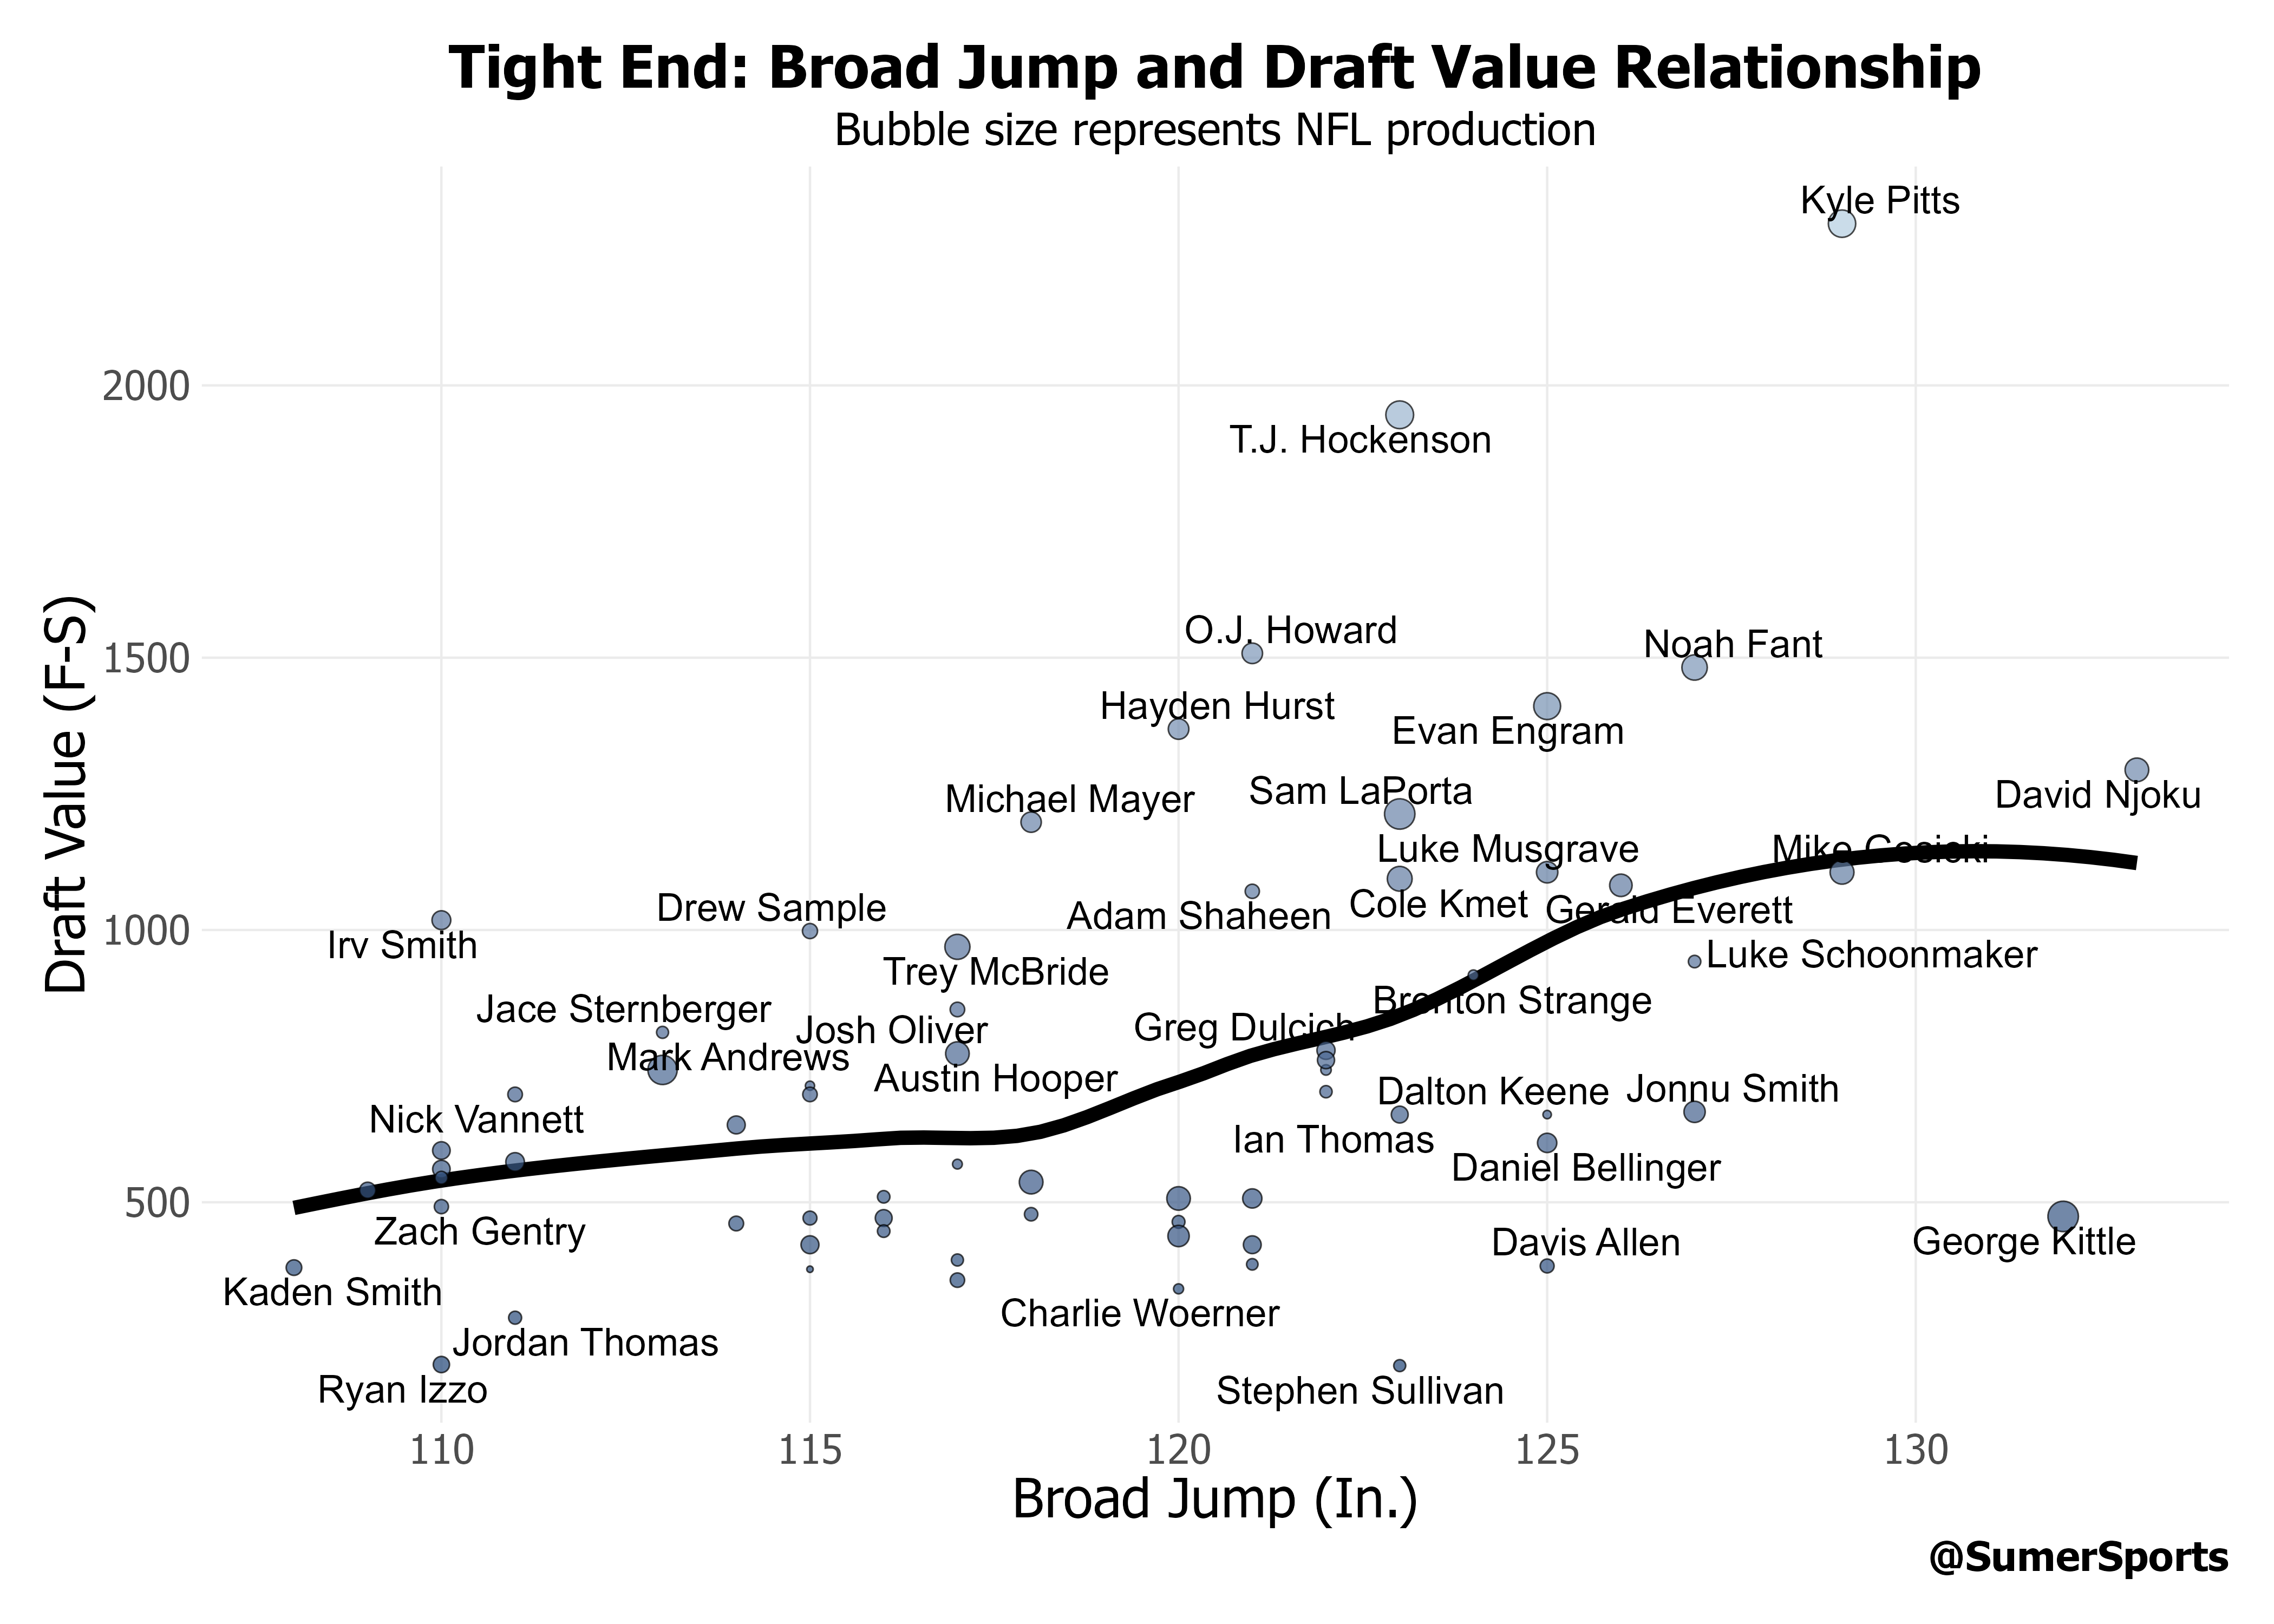
In fact, if a player doesn’t broad jump more than 120 inches, they are most likely to not be taken in the 1st round; Michael Mayer falling to the 2nd round was a good example last year.
Offensive Tackle

For offensive tackles, there aren’t as many great measures of their production, so percentage of snaps played per season was used to measure the signal in volume. Forty time matters here as tackles are asked to do a lot in the run game as they climb to find defenders at the second and third levels. Surprisingly, bench press is negatively correlated with playing time.

Teams are capturing the importance of forty time when selecting offensive tackles. They are also strongly considering age and shuttle time. It could be argued that they are not considering three cone time enough.

While Orlando Brown - who went on to have a successful NFL career - stretches the chart, it is still clear that to be drafted highly, an offensive tackle’s forty time is usually 5.3 seconds or less with a pretty strong 5.4 second cutoff.
Interior Offensive Lineman

For interior offensive linemen, forty time means a lot less while the quicker movement events like three cone and shuttle time mean a lot more. Also, bench press is strongly correlated with playing time while it was negatively correlated for offensive tackles.

It seems three cone times slower than 7.8 seconds make it tough for an interior offensive lineman to succeed in the NFL. Cordell Volson is the outlier here, but he has only played one season at guard for the Bengals.

When drafting guards and centers, teams are strongly considering age in their decision. After that, they are correctly focusing in on shuttle time and three cone time.

The guards that teams have drafted almost always run a shuttle time lower than 4.8 seconds (except Kenyon Green).


