Most of the new and interesting NFL advanced stats coming out have their roots or at least some inspiration from the Big Data Bowl. The Big Data Bowl has been running in one form or another since 2019 and is the single best pipeline to enter the NFL as a data scientist bar none. Here at SumerSports we have several analysts who competed in the BDB since its inception.
If you’re on Twitter, and God help you if you are, you may have run across this tweet from former PFF and current 33rd Team contributor, podcaster, and analyst Sam Monson talking about the use and misuse of football data and the explosion of these new NFL advanced stats.
Now, I don’t agree that no one has any idea what they’re actually useful for, but I do agree there is a lot of data misused on the internet and not necessarily in bad faith, though that happens. Sometimes people don’t know exactly what a data point or model is measuring, so they misattribute the results. So, let’s talk about modeling assumptions and what some of these models actually mean and when you should and shouldn’t use them.
The Nuance of 'Expectation'
One of the most loaded terms in NFL advanced stats is expectation, what the heck does this mean? Well, every single metric that says expectation means something slightly different. In Expected Points Added the expected essentially means game state, in Completion Percentage Over Expectation it means degree of difficulty (kind of, more on that later) so it’s unsurprising this term causes confusion. Expected value essentially means the average value given your assumptions but those assumptions are not always obvious which is why this article is here.
What is Expected Points Added (EPA) and how to use it
EPA has been written about at length in many places and I won’t rehash all of its benefits or problems here. The easiest way to think about EPA is “yards with context.” You can use that context to do a lot of interesting analysis such as better define what success means on a particular play or down. Using EPA to define success rate simply means setting your success criteria to say “did we get closer or farther away from scoring points?” Nate Tice of yahoo does a great job talking about the interrelationship of EPA to success rate here:
EPA is a great way of knowing how well your team is doing in a particular phase of a game and answering questions like “how good was the 49ers passing offense in 2023” and “which teams had positive rushing EPA last week?” It converts individual yardage into points using the context of field position so that we can have more informed conversations about how well teams are doing at both the college and NFL level. If you’re curious about the history of EPA, Eric Eager (now of the Panthers) and I talked about the history of football analytics at the 2023 Sloan Sports Analytics Conference.
Where things go wrong is trying to assign EPA to individual players. When you try and then make a statement on player quality, especially QB, using EPA we very quickly run into trouble unless you’re willing to call the 2023 and 2022 MVPs the 13th and 14th best QBs in the league in 2023 respectively. And while several very smart people have tried to make adjustments to EPA to make it more usable as an individual metric there is simply too much uncertainty in the division of credit in public play by play data to make those metrics work well given publicly available data. Credit assignment in football at any level is difficult, but even more so when constrained by the limitations of public data and without integrating subject matter expertise. I won’t be so bold as to say it’s impossible, but given the complexities of football I would be extremely suspicious of EPA at the player level without substantial evidence that it’s meaningfully isolated player performance rather than an entire side of the ball or heavily capturing coach preferences. I also accept the profound irony of me making these statements given that we have EPA listed by player on our website.
Wide Receiver Separation and Completion Percentage Over Expected (CPOE)
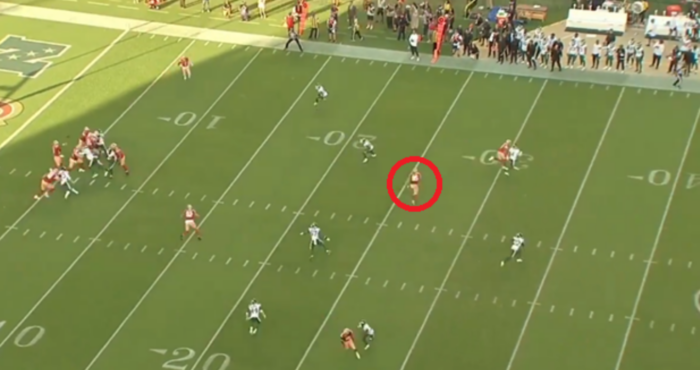
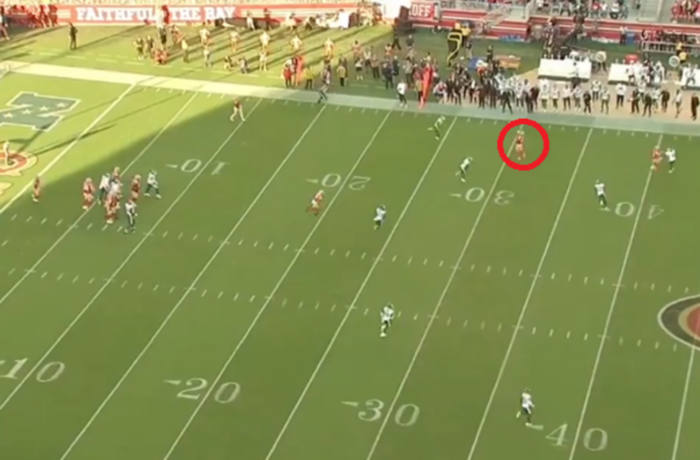
You need, at minimum, two wide receiver separation metrics, expected separation given the defensive coverage faced at both time points, and a route indication to really be useful when discussing the intertangled relationship between passer and receiver. In many cases the separation when the ball arrives is heavily entangled with throw quality and play design. Lets talk through an example.
Let's look at the moment the ball is thrown first:

And again, when the ball arrives:

I chose this example specifically because it’s a difficult division of credit problem. Is this a bad throw by Purdy? It’s a little high but he’s also trying to throw over the top of the defender so it’s fine. Is it a particularly amazing route by the pass catcher? The route itself is fine and does the job. Is the play design itself using shift motion helping a lot here? Absolutely. So who does the separation belong to in this play? Kyle Shanahan? Brock Purdy? George Kittle? An uncomfortable combination of all three that’s just flexible enough to use in whatever narrative you’re concocting?
The truth about both separation at the time the ball arrives and things like CPOE are as much stylistic indicators as they are measures of performance for the offense. You should use something like receiver separation to begin asking questions about a particular play or game rather than assigning them to the receiver as a measure of performance or value. Alone, there simply isn’t enough information to tell you definitively anything about the quality of play calling, receiving, or quarterback play. For that you would need multiple models as we indicated above. If arrival separation, as a single measure, is indicative of anything, it’s a measure of how well the defense read the play.
CPOE is very similar in this respect. CPOE simply measures completion percentage adjusted for difficulty of throw where one version uses separation at time of catch and the other does not. This metric tells you a little something about how difficult the throws a QB chooses to make and absolutely nothing about the throws they don’t. If you want to learn more about CPOE, you can read an overview comparing the PFF and nflfastR versions here.
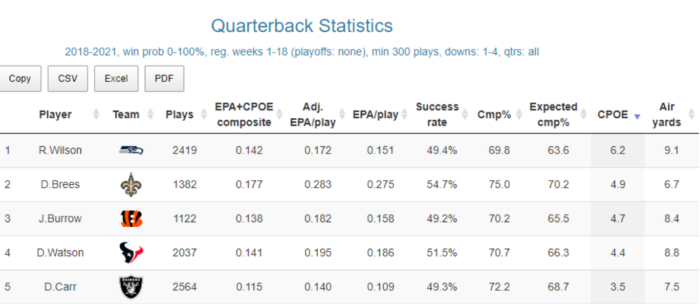
As an example, let’s talk about Russell Wilson. Near the end of his time with the Seahawks from 2018-2021 Wilson had the highest CPOE in the league among starting QBs (min 300 snaps over the 3-year span).

2018-2021 CPOE leaders thanks to www.rbsdm.com
But does this mean that Wilson was the best QB in the league over that three-year span? And what does it mean when his CPOE plummeted to -1.2% in 2022 (26th in the league) while his replacement in Seattle, Geno Smith, then led the league at 5.6%?
Again, CPOE at its heart simply answers the question of how well you completed the throws you decided to make compared to the difficulty of those throws and in most versions of this model that is heavily driven by depth of target. What we should take away from this metric is that some offenses are designed around taking deep (often play-action) shots and those deep shots are higher in difficulty due to their distance. CPOE is not, by itself, a measure of Quarterback quality. It is a measure of offensive style.
Here is what CPOE told us about Week 1 of 2024:
- Near zero CPOE: QB is probably not taking any risks (Cousins while returning from injury)
- Low CPOE: QB probably missed some easy throws (Williams)
- High CPOE: QB probably completed some deep shots (Allen)
None of these things are a holistic QB evaluation, but they are interesting context when going back and evaluating a game. So, when we look back to the above questions about Seattle we should think of CPOE as only partially a Quarterback stat, but just as much a measure of the offensive system in which a player operates. Good Quarterbacks especially change teams in the prime of their careers so seldomly that we should be careful that which we attribute exclusively to the player. Or, as the great Adam Harstad says, “Everything is selection bias.”
Rushing Yards over Expected (RYOE)
The 2020 BDB winning model powers the RYOE metrics listed on NFL’s Next Gen Stats. This model, and others like it such as xYAC (expected Yards After Catch), rely on a neural network architecture that is often used with images to help classify them and include numerous features including the speed of the rusher/receiver when making a prediction for how many yards we expect that play to go for. At the time this model was the best, most accurate way to predict the number of yards a play would go for and it still performs well after many years and a few updates. If you’re using this class of models to talk about the relative efficiency of an offense for game preparation or predict play level outcomes you won’t run into any problems, but using them to assess player talent, there are some things to be aware of.
Whose residuals are they anyways?
In layman terms you can think of a residual as distance between a predicted amount and an actual amount. In something like RYOE we add together all of the residuals and report that back for the running-back on a particular play. This is what the OE in RYOE really means, over expected, or how far above or below an RB is away from the model predictions over the course of the season. But what if the residuals themselves are biased? What do I mean?
In 2023 Tyreek Hill scored 5 xYAC per reception behind such speed demons as Tyler Higbee and Chigoziem Okonkwo. James Connor registered nearly twice the RYOE per attempt of Breece Hall. There is nothing wrong with Higbee, Okonkwo, or Connor as players. But if you were to replace a random running back on a play, would you rather have Connor or Hall? For a pass would you rather have Higbee or Hill to gain yards after the catch? The answer to these questions should be fairly obvious. So, what’s going on? Is there something wrong with the model? No, the model is doing exactly what it was designed to do.
RYOE and xYAC were built using the speed of the ball carrier/receiver as features of the model. That is, the model knows how fast the player is going when it predicts the end yardage of the play. If you were trying to be as accurate as possible in predicting a play outcome, which was the stated goal of the 2020 BDB competition on Kaggle, then of course you would use the player’s speed to better inform your model. But, in doing so, we build in Tyreek Hill’s speed into the expectation which means if the model sees him going 20 MPH on a play and expected him to go 19.5 MPH, he gets very little credit for being one of the fastest players in the NFL. This causes problems when we then use this class of models to say something meaningful about a player’s latent ability and traits.
If we were making a model to assess player talent for teams, something which we do here at SumerSports, we would exclude things that belong to the player from the expectation. We want to make sure that, as much as possible, the residual captures everything that belongs to the player so that when we say a player is above or below expectation, we are giving an assessment of their talent rather than play outcomes. While we should expect these model results to be correlated with each other, there can be surprising differences especially for players who change teams.
What to take away from all of this...
The NFL and third-party vendors are in a tricky place with respect to NFL advanced stats and public consumption of them. It’s extremely tempting to take a model that works well at predicting one thing and using it for something else, especially during the regular season content cycle. But when we use models, we should take a peek under the hood and ask some simple questions. What is being predicted? Is the target prediction a player, play outcome, or maybe something else entirely? Are there confounders? And most importantly of all, does it confirm my priors?
I’m glad to see some lively stats debate back on social media. Between the hot takes and cool air, it means fall is finally here and for that I’m thankful.


