Introduction
Sack and pressure analysis is a well-researched football analytics topic. We know that pressures are not only hurtful to an offense by themselves, but they are also more predictive of future sacks than sacks themselves from a pass rusher's view. From an offense's view, sacks are one of the passing stats that is more tied to the quarterback than others. However, this work only looks at the result of each play, what we call the "play level."
At SumerSports, we are training models that take the analysis to another level by making frame-level predictions of whether a play turns into a pressure or a sack, from both an individual rusher's and the quarterback's perspective.
Among other things, we want to use this article to study how quarterbacks react to pass rush threats in a level of detail that hasn't been possible with play-level pressure data before. In particular, we are going to present a finding that finally resolves a disconnect between analytics and watching film. In the past, the analytics finding has been that the performance under pressure is generally less stable than performance from a clean pocket, but this doesn't hold up against this analysis.
Not all pressures are created equal
With the help of frame-level pressure measurements, we can look at how dangerous a pressure really was.
But before that, we look at another category of plays: Near pressures. Obviously, not all clean pockets are created equal either and there are plays where the model saw an elevated pressure probability at some point, but ultimately didn't see a pressure.
We're controlling for the structure of the play, because we want to identify legit post-snap near pressures, not defensive pressure looks, which will result in a higher pressure probability at the snap frame already.
We can see that near pressures which peak right before the throw have a similar detrimental effect on EPA per play as hurries, i.e. SūmerSight-charted pressures which do not result in a sack or a hit. Those can probably be interpreted as near pressures that caused the QB to rush a throw (or throw it away).
A near pressure that peaked at the throw was most likely barely registered by the quarterback or he found a solution before the pressure could get to him, so they don't affect the play efficiency much. Near pressures that peaked long before the throw could've potentially developed into more dangerous pressures, but the quarterback and the offensive line apparently found a way to escape the pressure, so the QB was ultimately almost not negatively affected at all.
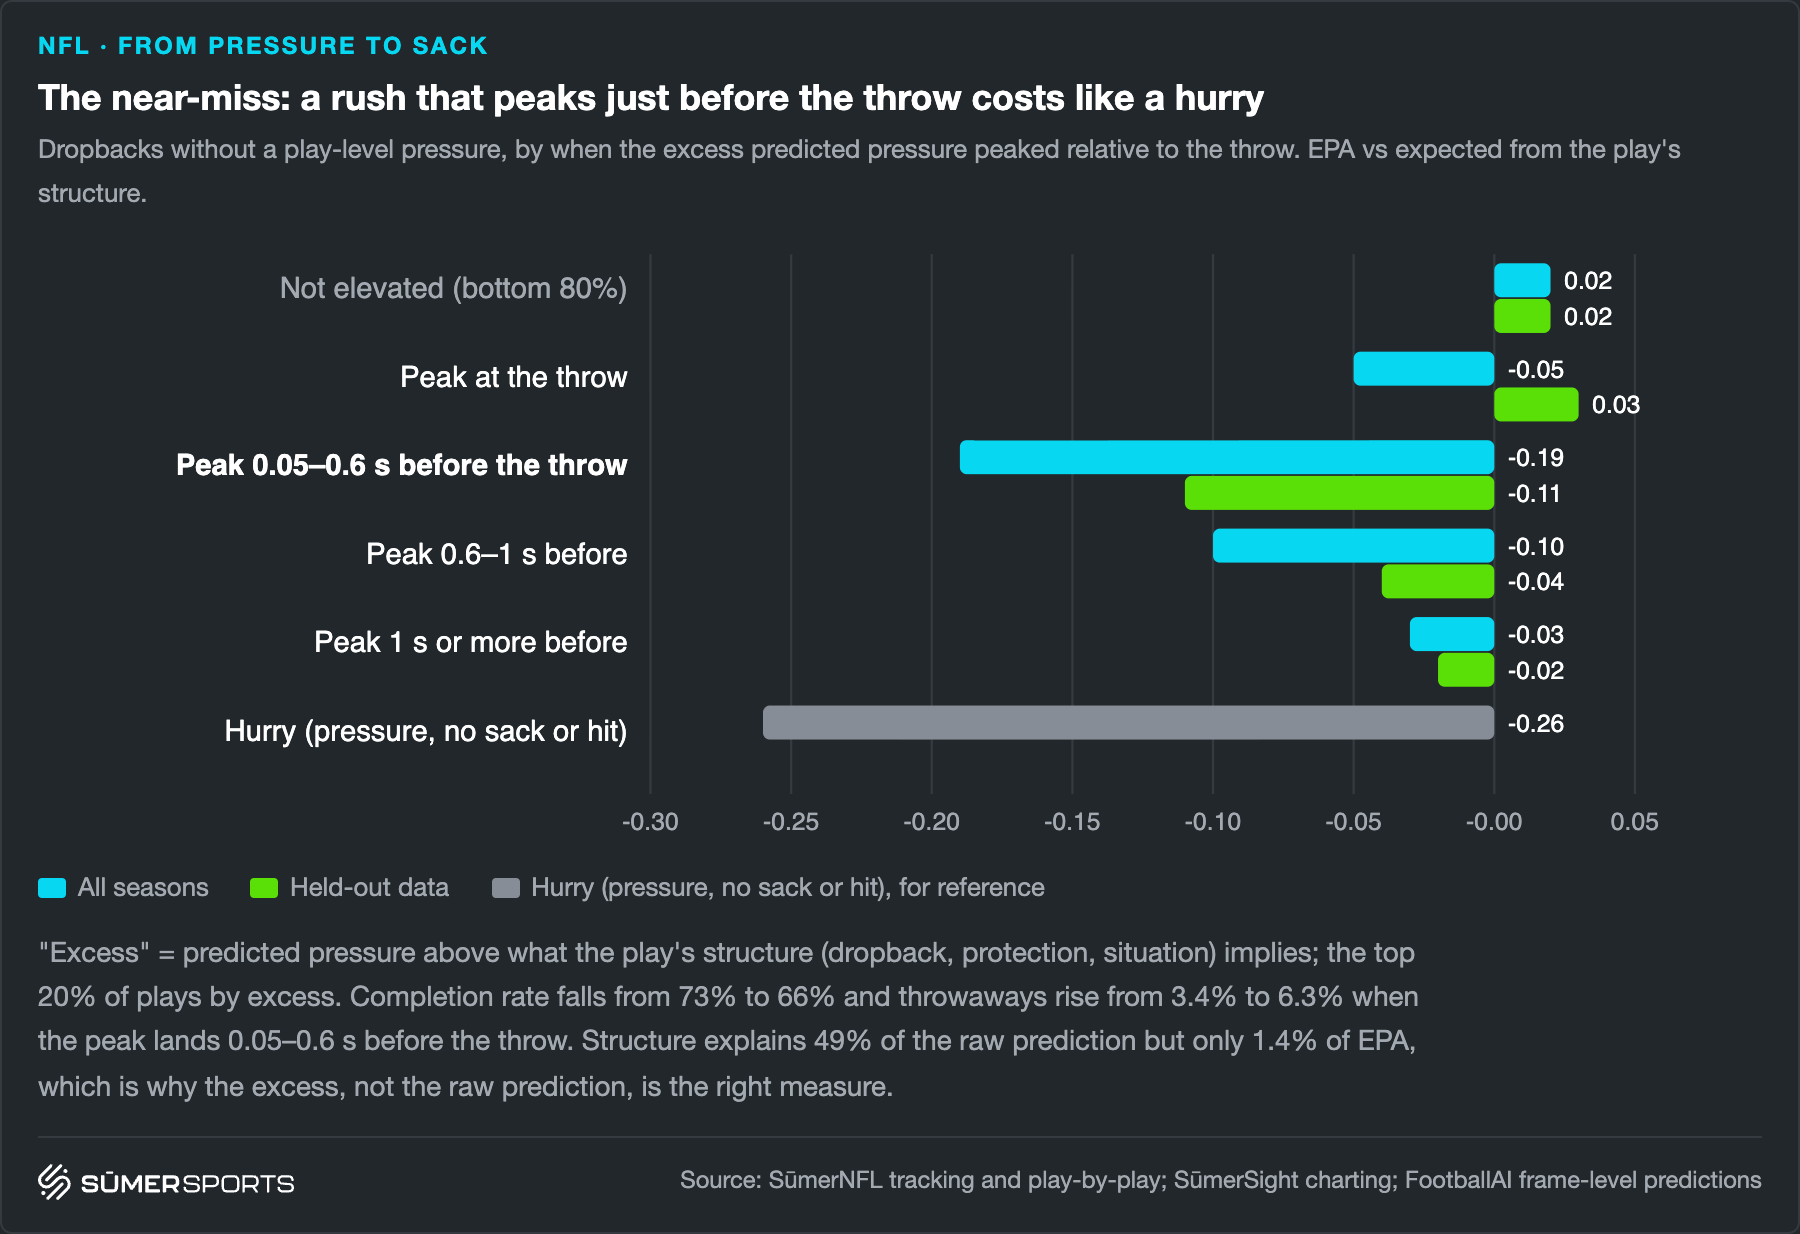
This is an initial finding that lends credibility to the frame-level pressure measures. Filling the binary pressure indicator with a continuous frame-level probability spectrum between clean pockets and plays with pressure can only make sense if said spectrum also fills the EPA gap between clean and pressured plays and that's exactly what's happening.
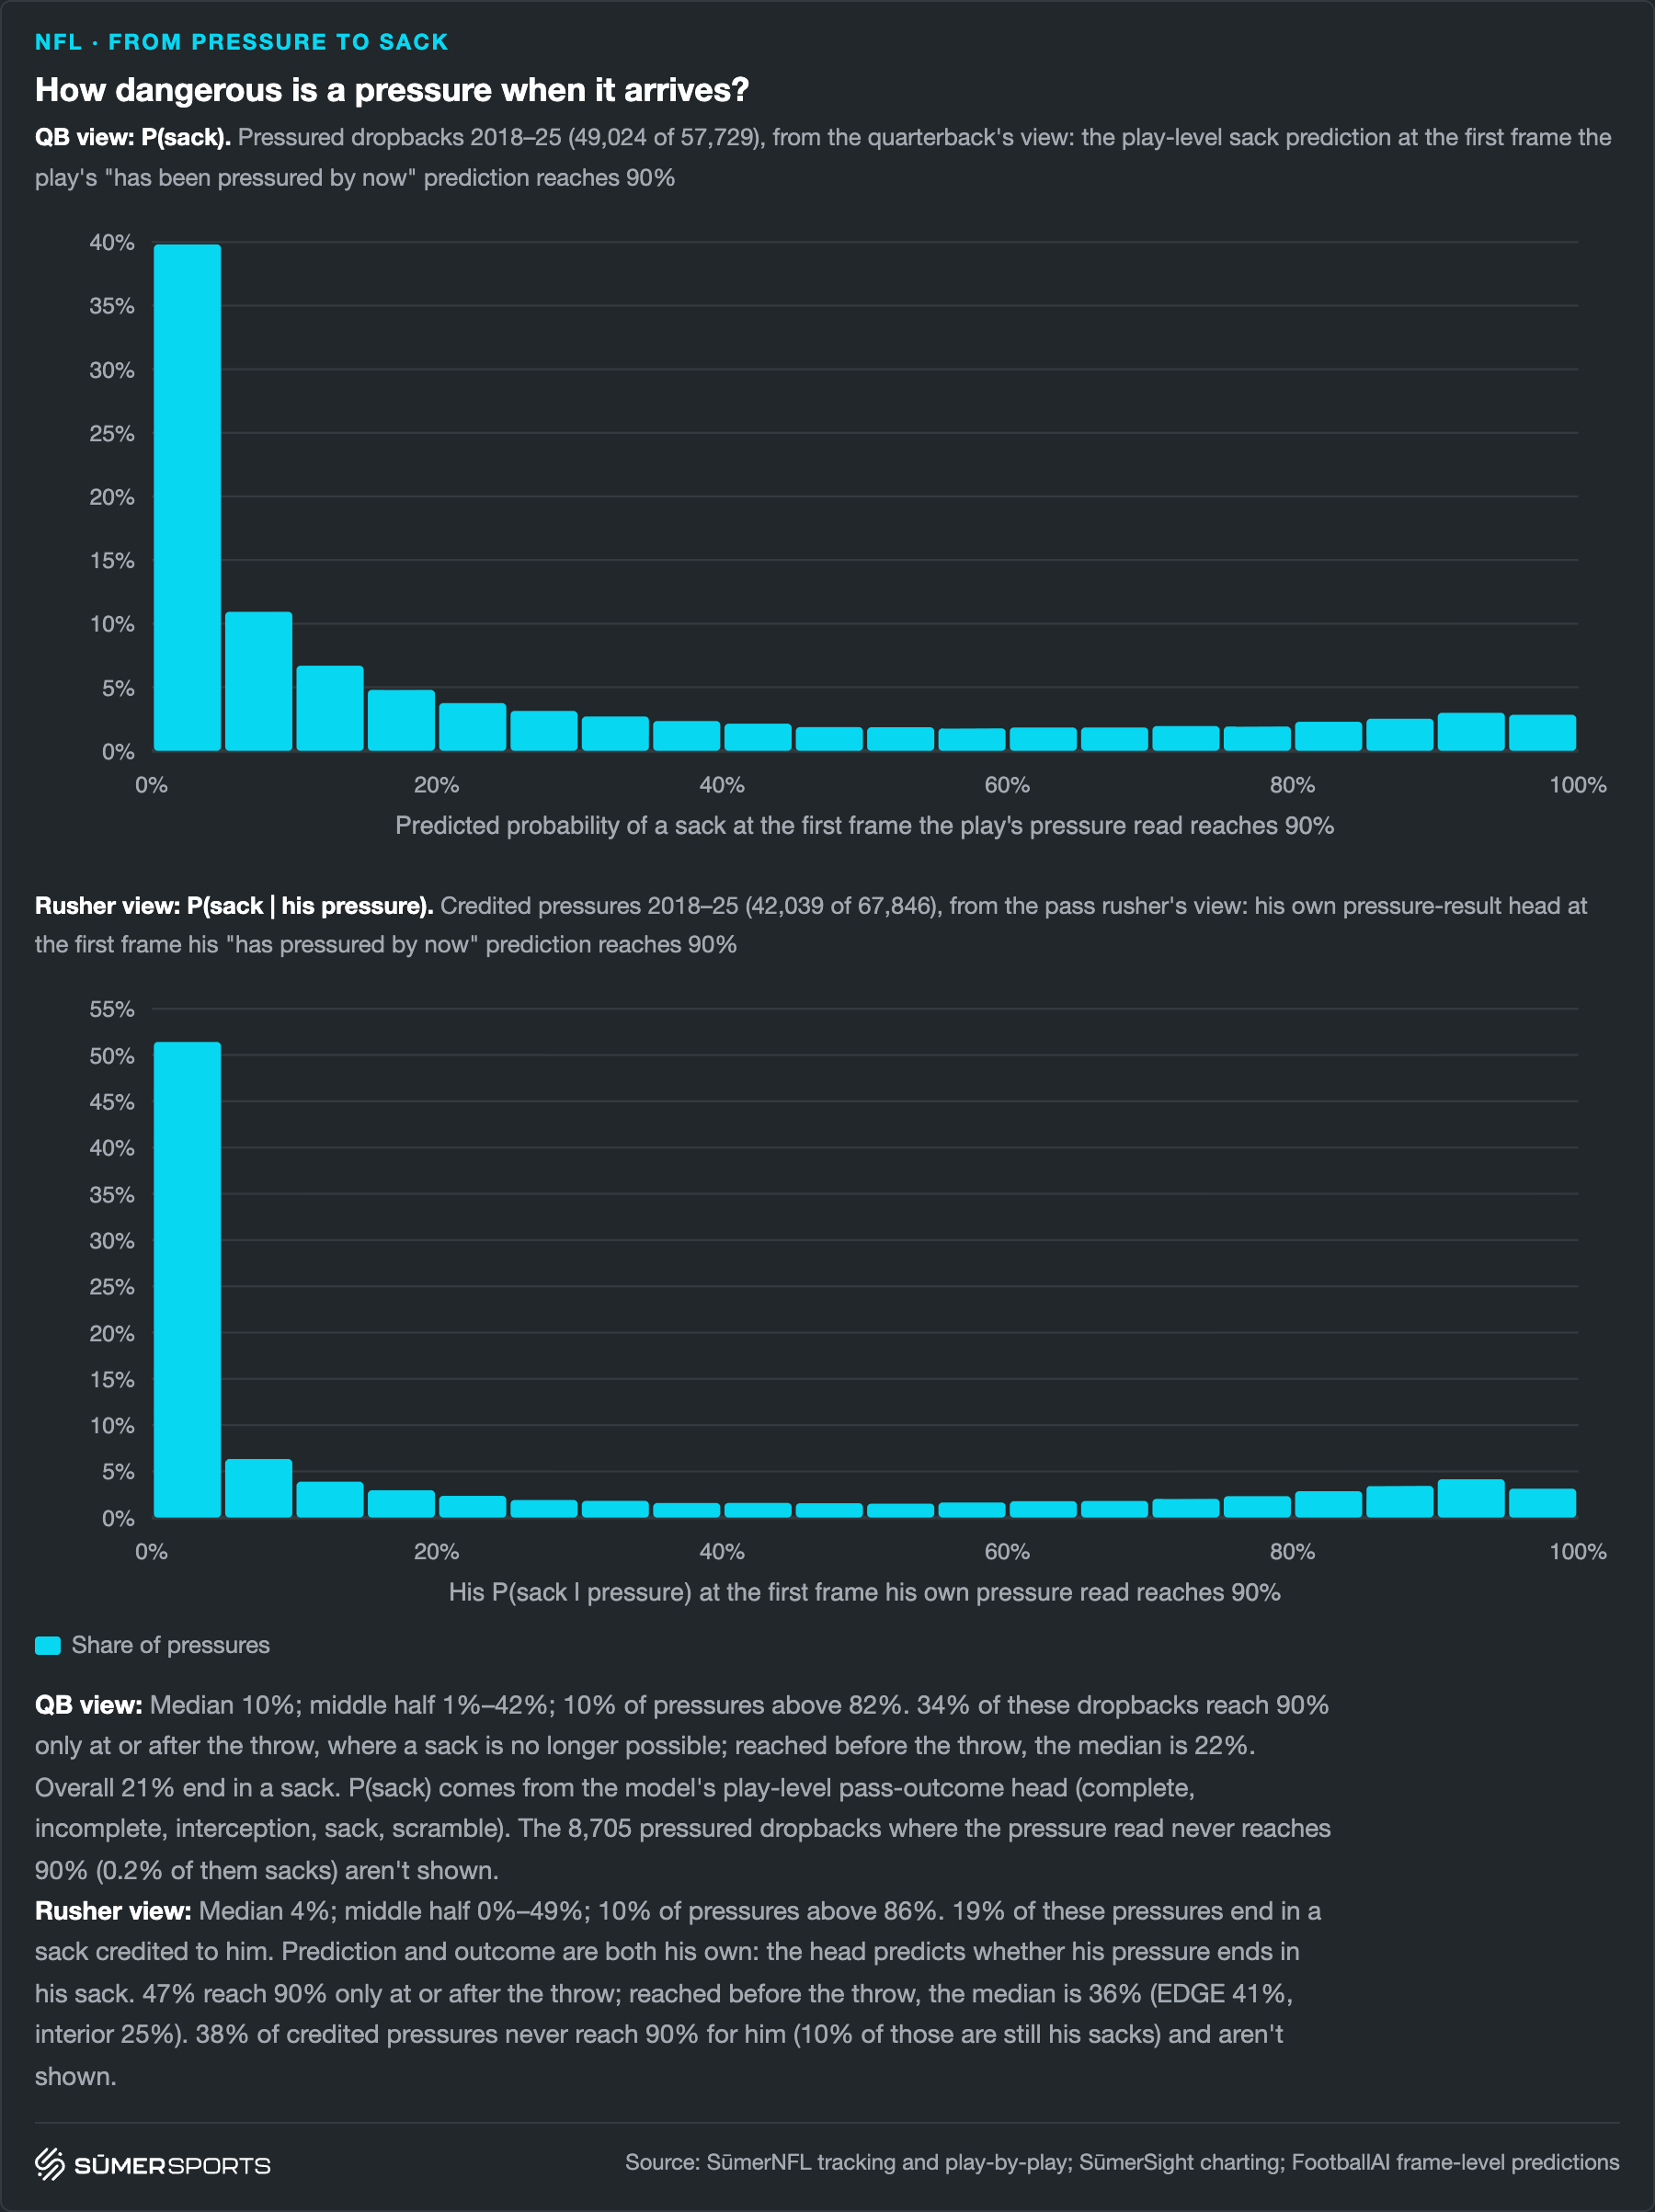
When looking at plays with play-level pressures, it turns out that most pressures are fairly harmless in terms of sacks: The median pressure has a sack expectation of 10% at pressure arrival and for an individual rusher the median sack expectation at pressure arrival is only 4%. With pressure arrival, we mean the first frame at which the model has 90% confidence that a pressure happens. The sack expectation of a pressure is the model's judgement of the sack probability at this frame.
This is because a large number of pressures actually cause the quarterback to release the ball at the moment it arrives, so they will inherently never force a sack. However, there are also pressures that put the quarterback in serious jeopardy when they arrive. The heterogeneous distribution of sack expectation at pressure arrival has two consequences for our analysis:
Most importantly, we have to rethink pressure-to-sack traits for both pass rushers and quarterbacks, since whether a pressure turns into a sack has two layers now: Was the pressure even putting the quarterback in jeopardy in terms of a sack and the second layer is what has been the only layer in past play-level pressure-to-sack analysis: Based on the sack expectation at pressure arrival, how many sacks are we observing?
Another important consequence is that when analyzing how quarterbacks react to pressure, we have to carefully define the frame at which we start looking at the quarterback's behavior, because the pressure arrival frame can already include the quarterback's reaction to the incoming threat.
From pressure to sack: rushers don't finish, quarterbacks do
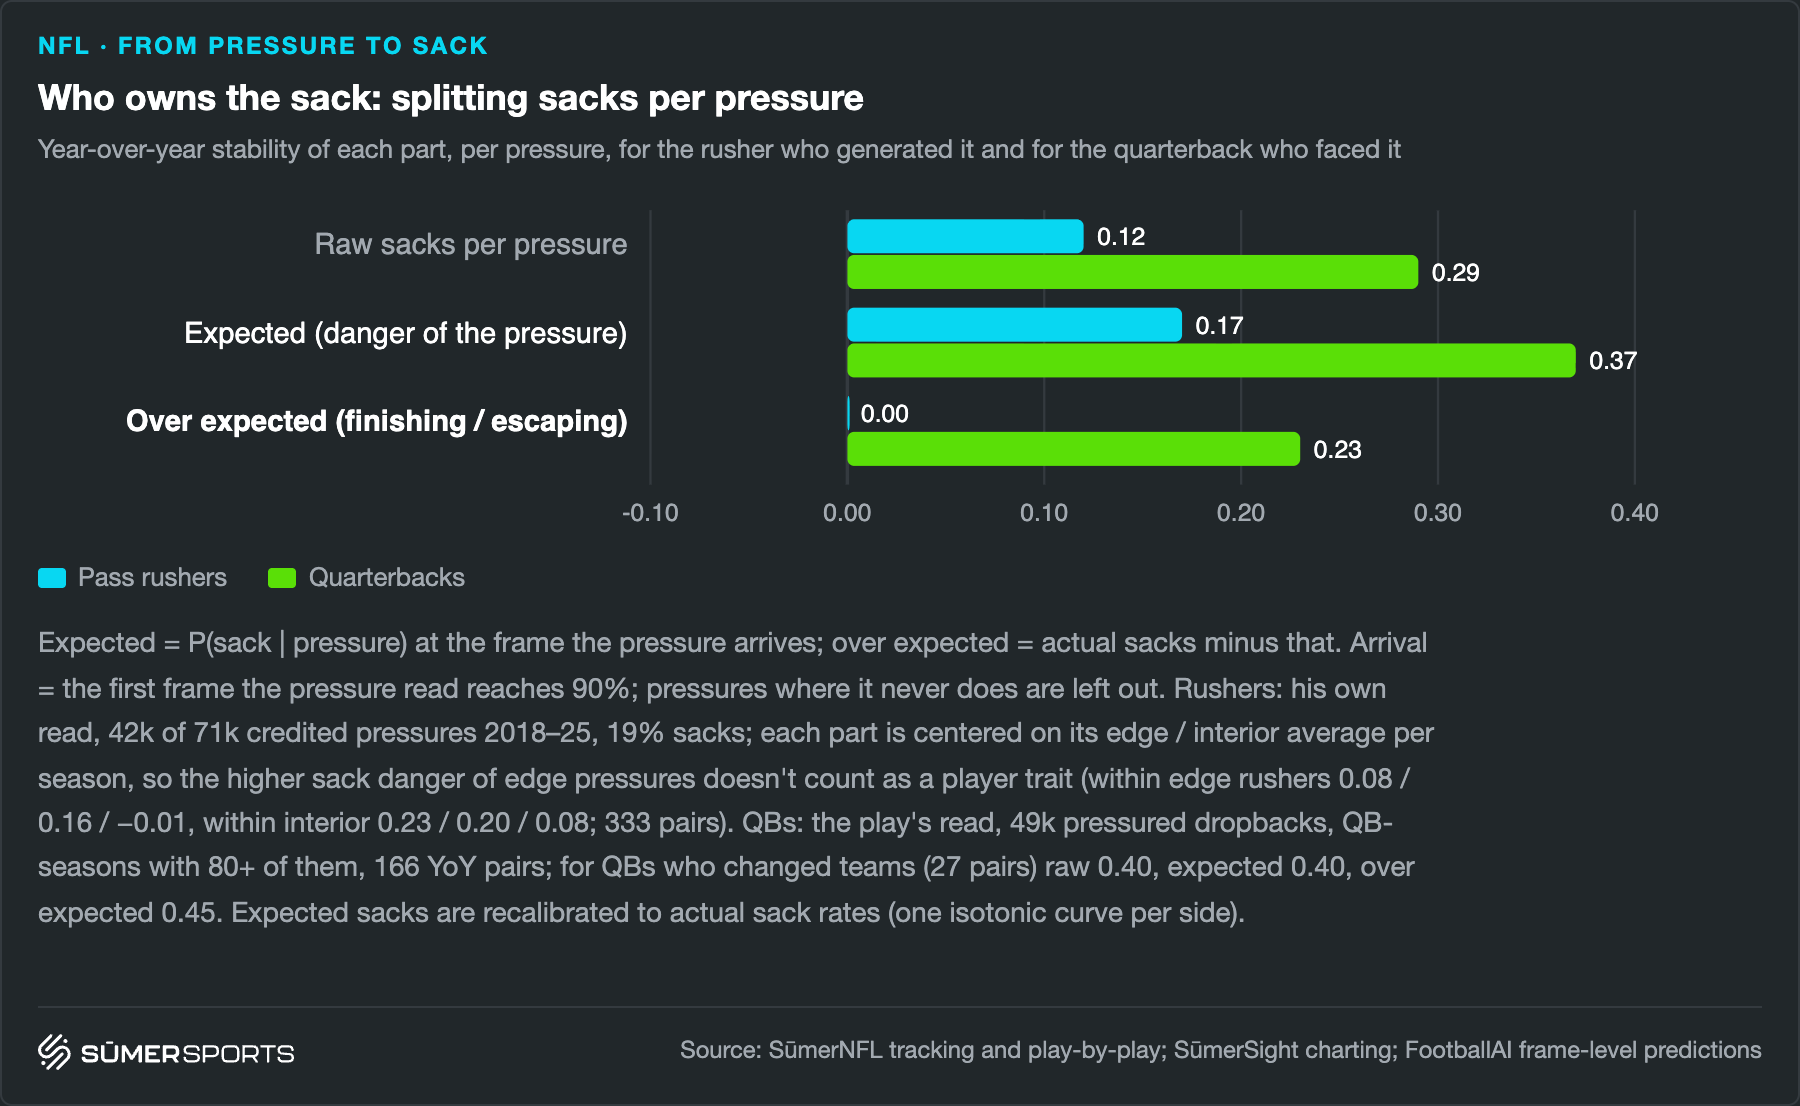
When looking at conventional pressure-to-sack analysis, it has always turned out that we find some stability for quarterbacks, but almost no stability for pass rushers.
We can now split this into two different measures: How stable is the sack expectation at the pressure arrival? And how stable are sacks beyond that expectation?
From a quarterback's perspective, both measures are roughly as stable as the raw sacks per pressure ratio, with the expected danger of a sack at pressure arrival being a little bit more stable.
From a pass rusher's perspective, the expected sack rate at pressure arrival is somewhat stable in the sense that all the stability of sacks per pressure is coming from the expectation, because there is no stability at all in terms of finishing sacks over what is expected at the pressure arrival.
The finding for quarterbacks implies that we should study them further and more importantly, when studying quarterback behavior under pressure, we can't start at the frame of pressure arrival, because apparently the quarterback already controls some of what happens before that. This is in line with our finding that most pressures come with a low sack expectation.
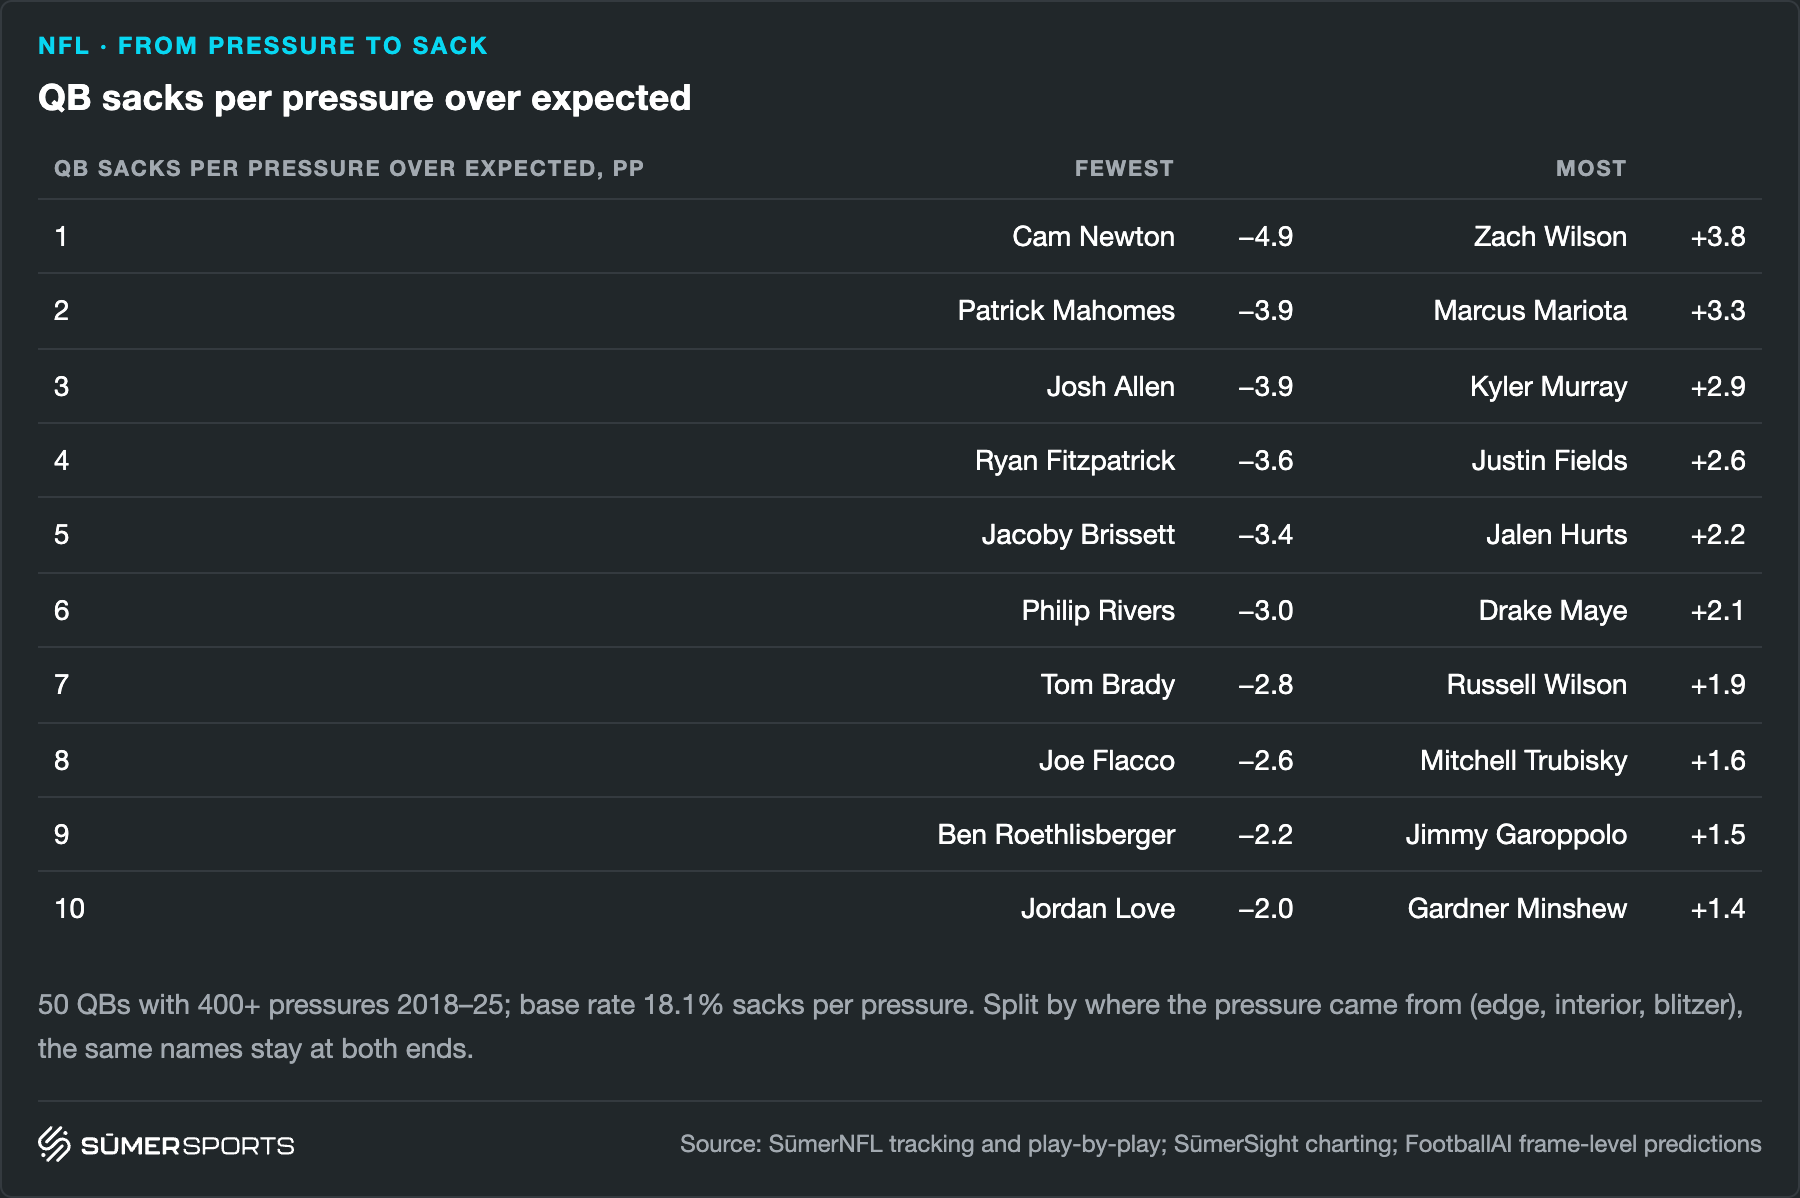
When looking at quarterbacks who got sacked the least relative to the expectation at pressure arrival, Cam Newton stands out, because his raw sack per pressure numbers are mediocre from 2018 to 2021. He got sacked on 18.4% of his pressures, as opposed to 12.1% for Patrick Mahomes or 13.1% for Josh Allen. However, he was put in the most dangerous situations at pressure arrival, namely an expectation of 23.4% compared to the league baseline of 18.1%. It's also notable that this wasn't prime Cam Newton and the sample size for 2018 to 2021 is fairly small for him.
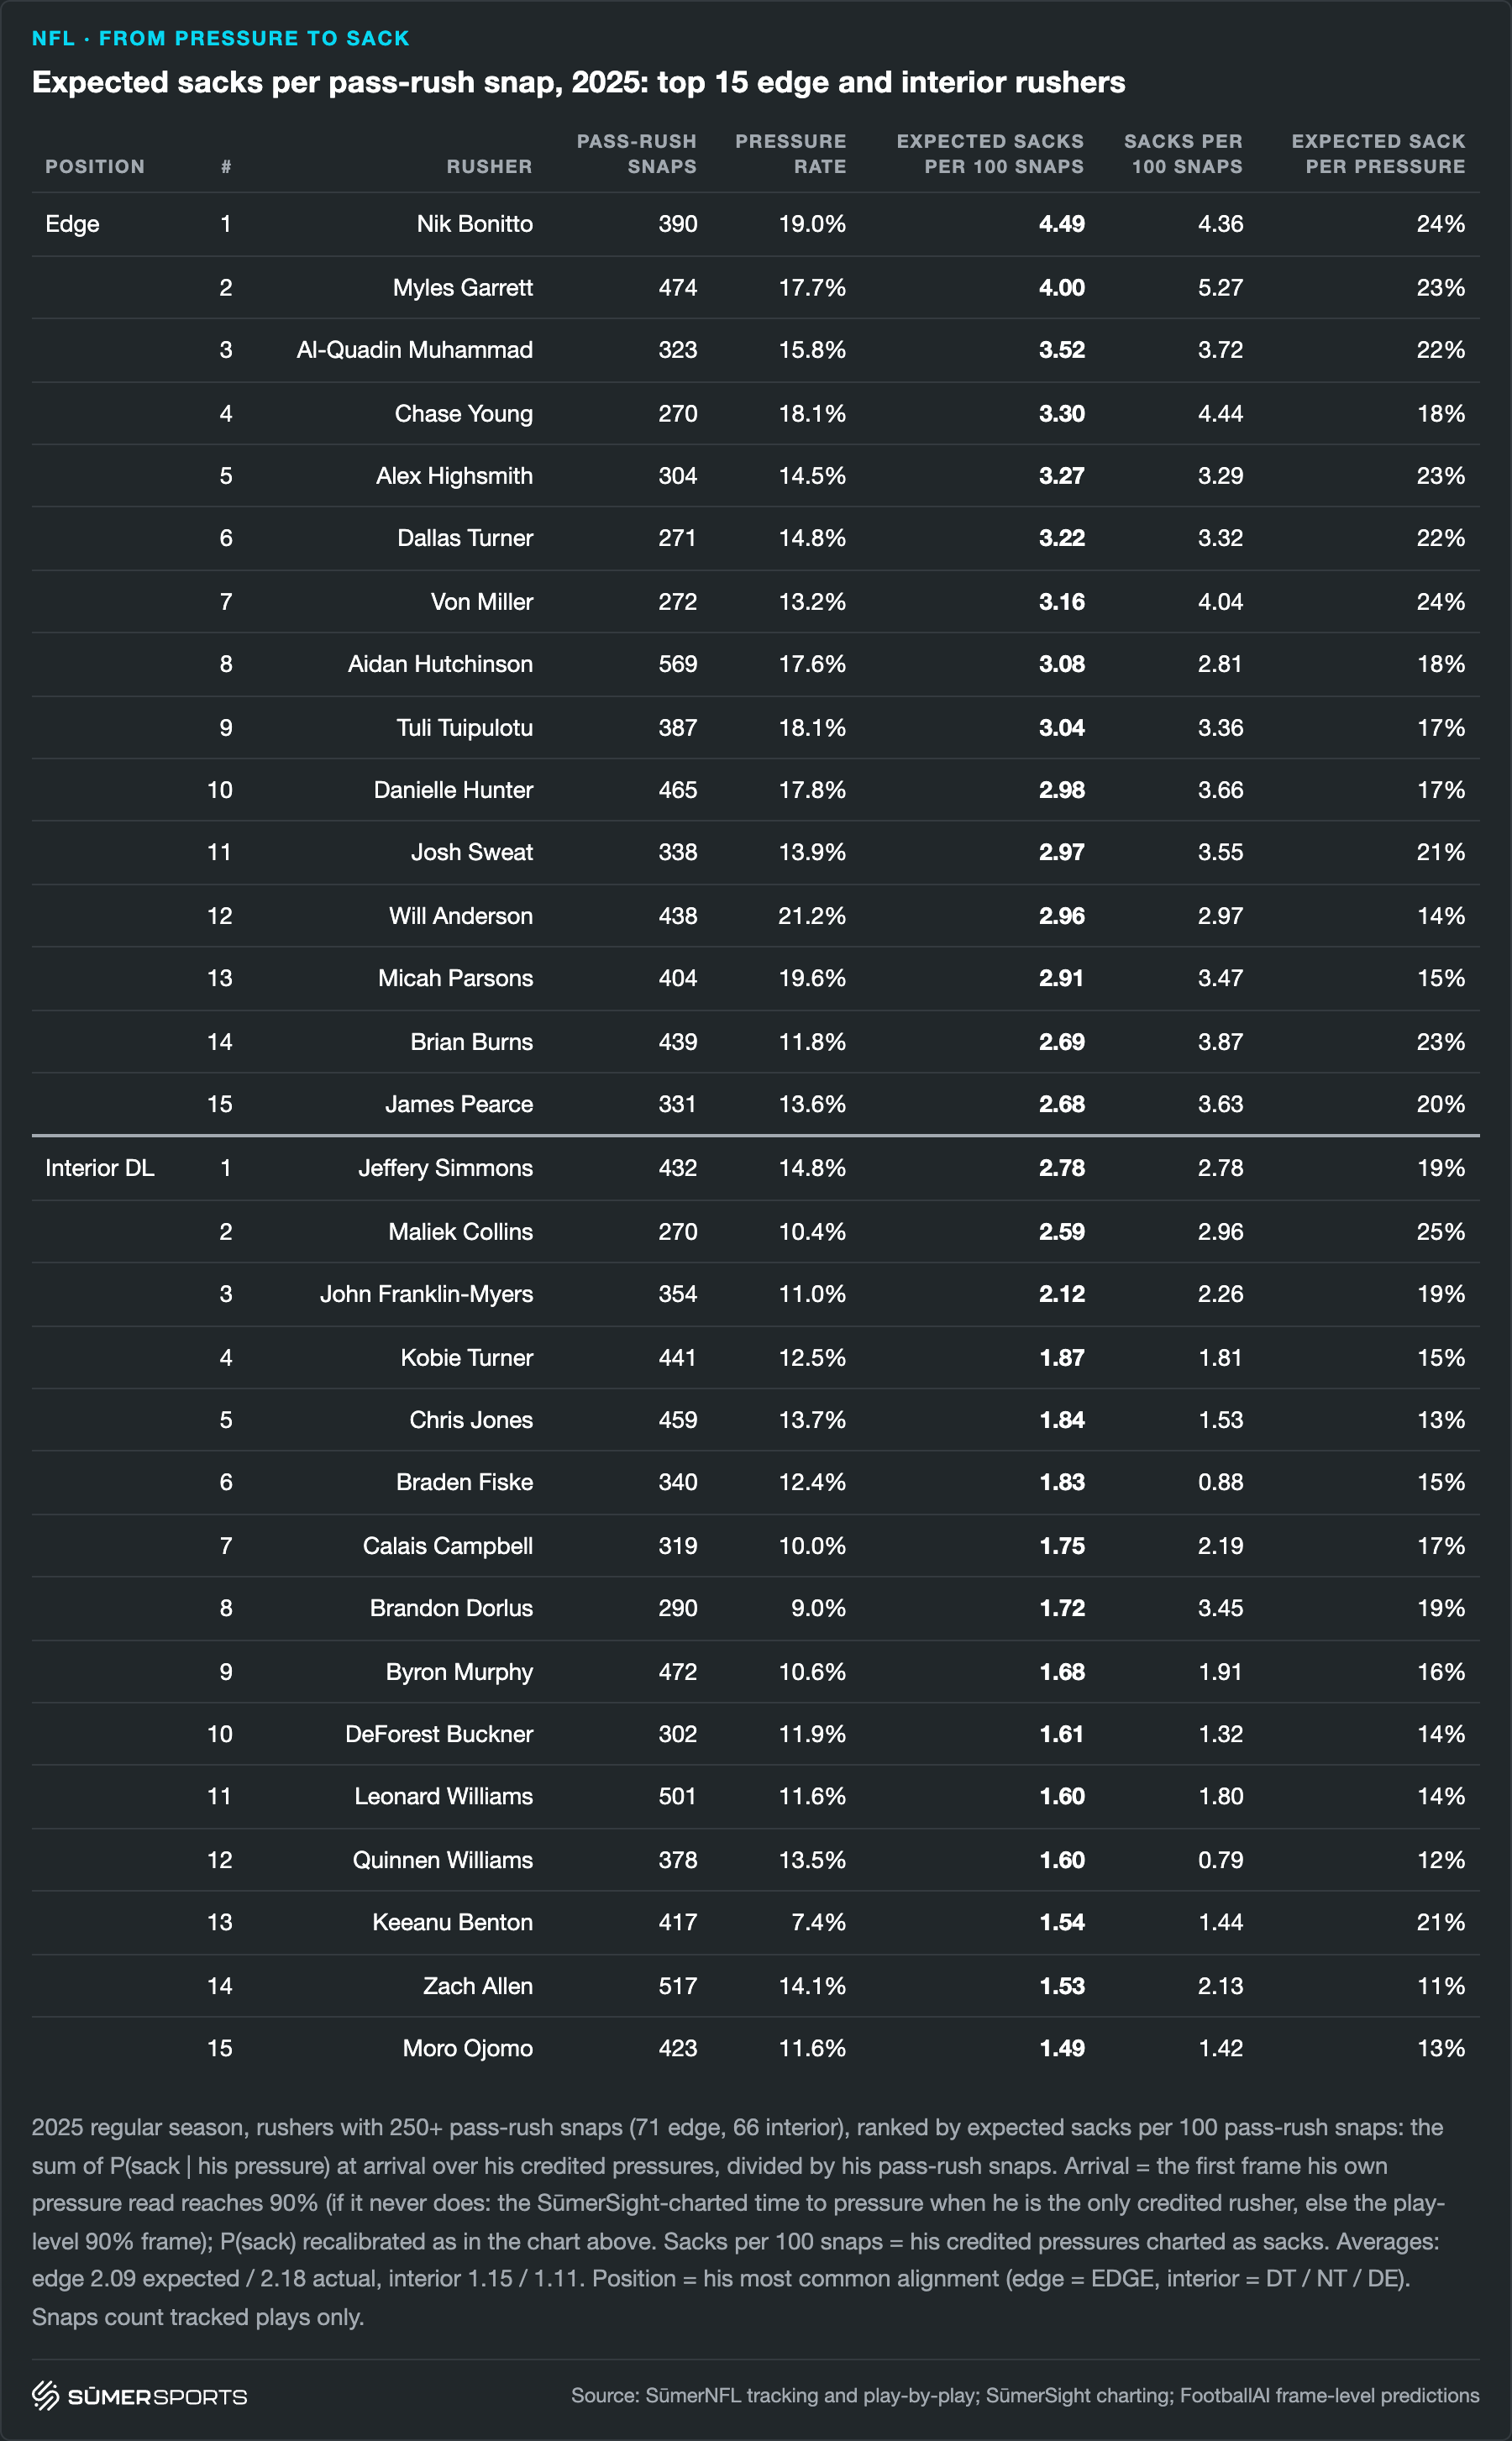
The finding for pass rushers implies that it might make sense not to report pressure rates alone, but to report the expected sack rate along with them. That is for every pass rusher we define his expected sacks to be the sum of the sack expectations on all of his pressures and divide this number by the number of pass rush snaps. Another way to phrase this is that we multiply his pressure rate by the average sack danger of his pressures. This stat is not as stable as pressure rate, but slightly more predictive of future sacks than pressure rate alone.
The following table shows the top 15 for both edge rushers and interior rushers in 2025.
It's notable that a sack is not the only way to hurt the offense via a pressure, so players with high pressure rates but lower expected sack rates (like Will Anderson and Micah Parsons) are more valuable than this table implies. The new frontier here would be to measure the overall disruption via pressures by also accounting for the general offensive loss of efficiency on pressures that do not turn into sacks. Since the frame-level EPA prediction at pressure arrival is confounded by things unrelated to the individual pass rusher, this is outside the scope of this analysis.
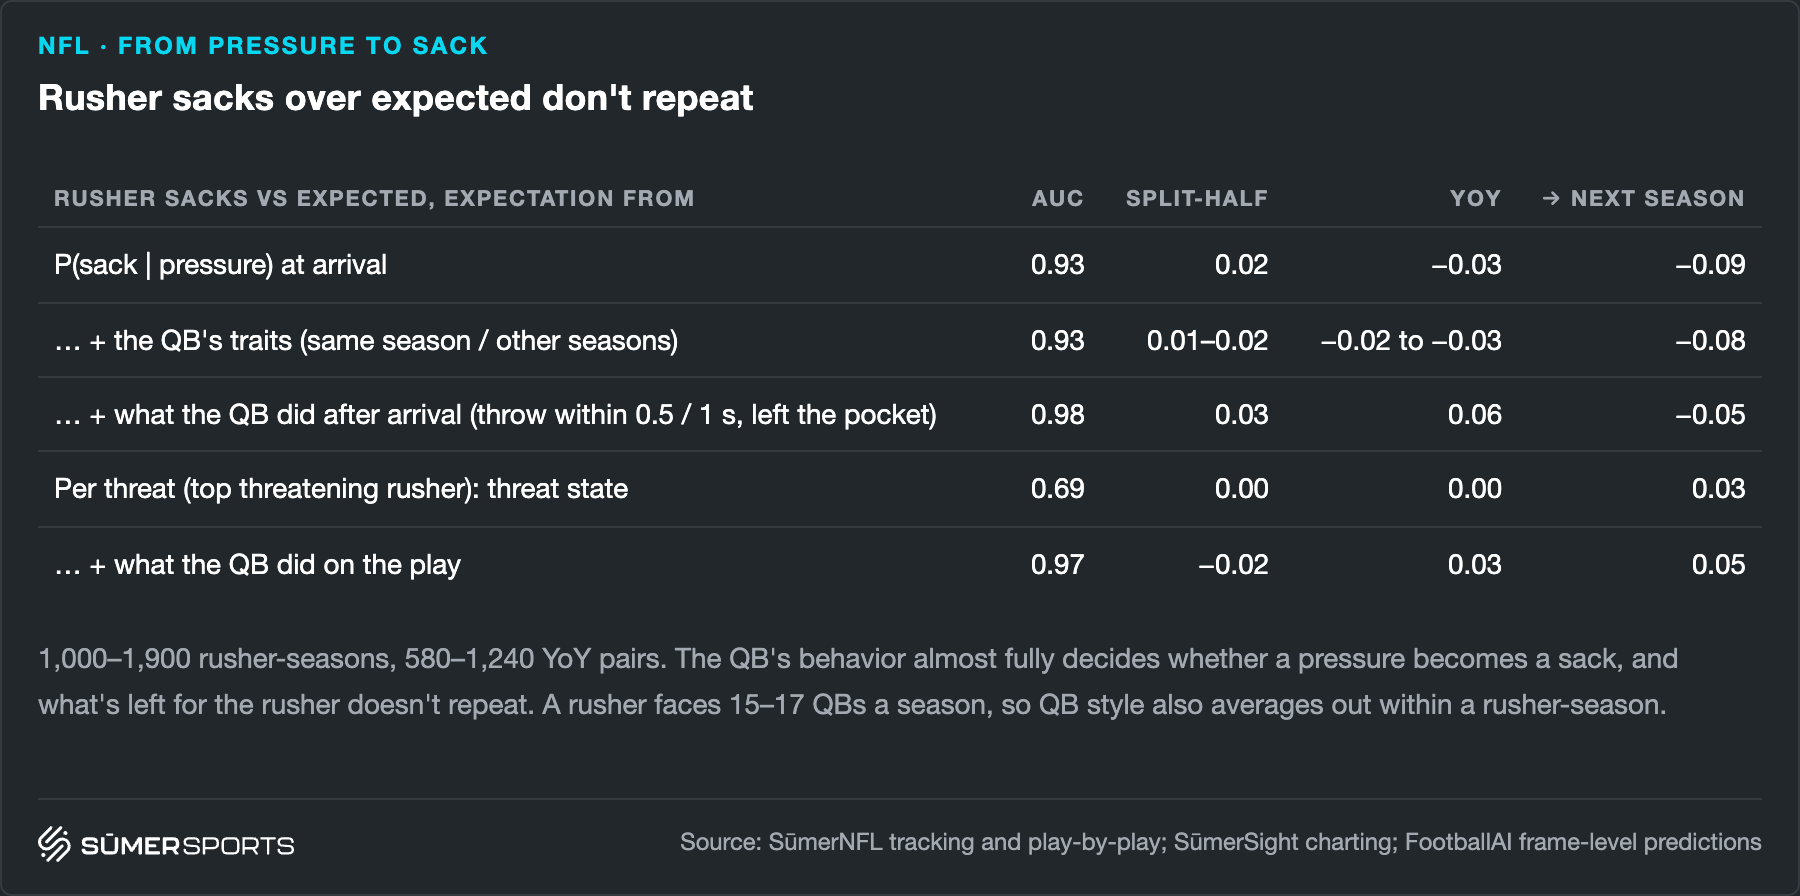
For pass rushers we can look further and try to account for other things such as the quarterback, both out of sample and in-sample. No matter how we slice and dice it, we do not find any stability in terms of finishing pressures to sacks.
How quarterbacks react
We want to study how quarterbacks react to an elevated threat of being pressured or sacked. We've already seen that the frame of pressure arrival (which we measure by the model being 90% confident that pressure has occurred by this frame) is not the ideal frame to work with, since the quarterback has already decided to get rid of the ball by that frame in a lot of cases, so the quarterback decision is inherently baked into the expectation at pressure arrival, so any study of what happens after this frame would lose a lot of information about the quarterback.
Instead, we are looking at frames at which the pressure prediction for the play crosses a certain threshold. Furthermore, we want to ensure that it's a threat that came up post-snap (an unexpected blitzer or a pass rusher winning his matchup), so we enforce that the pressure probability has risen at least by 0.2 compared to the snap. Looking at how quarterbacks would react to pre-snap threats (i.e. just pressure looks) is another topic and doesn't necessarily require frame-level measurements.
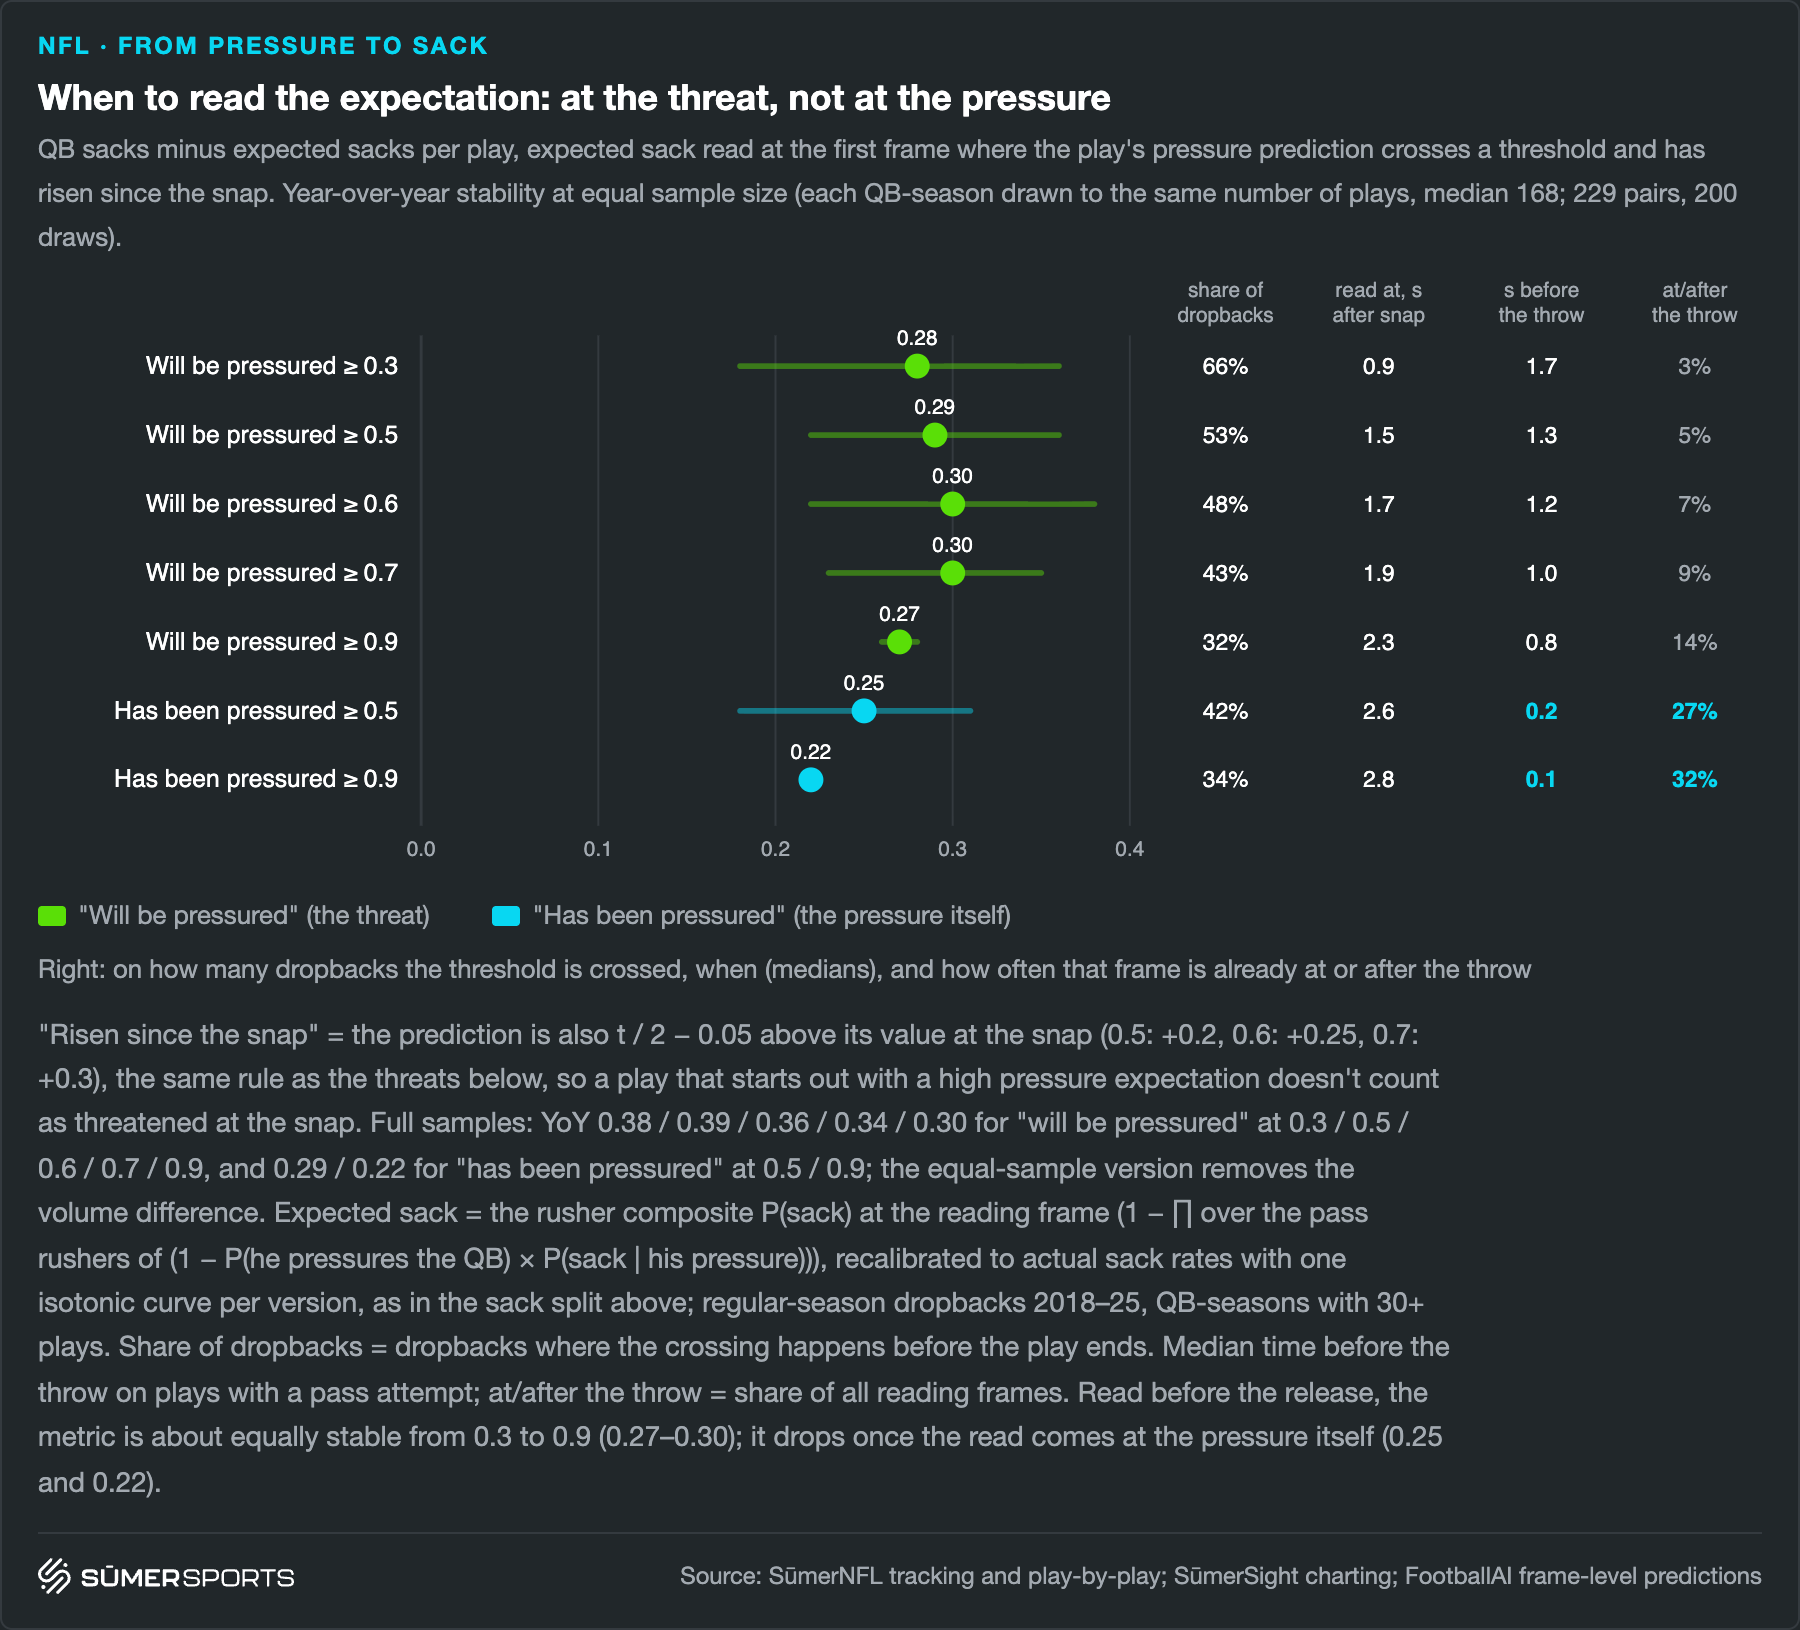
We want to find the sweet spot where the QB's sack avoidance over what we would expect at the frame where the threshold is crossed is stable and also make sure that the time range at which this threshold is typically crossed is meaningfully after the snap, but still before the throw.
The following chart suggests that a threshold of 0.5 is the sweet spot: Roughly half of dropbacks contain a threat, the sack avoidance is more stable than when looking at the frame where pressure arrived and the median time to threat is roughly halfway between the snap and the throw.
A thing we have to note here: At different thresholds, the sample sizes of plays are different, of course, i.e. there are more plays where the pressure prediction crossed 0.3 than plays where it crossed 0.7 and even more than plays where pressure occurred. For this reason, we adjusted the stability numbers for sample size by drawing random samples from each player season with the sample size matching the number of plays where pressure occurred. Since the correlation depends on a random draw, we drew 200 times and this is the reason why the stability numbers have a confidence interval. This suggests that sack avoidance per threat is slightly more stable than sack avoidance per pressure, even after accounting for the fact that threats happen more often.
We are further narrowing the definition of a threat a bit in order to filter out some outliers: A threat occurs at a frame where the pressure probability for the play crosses 0.5 for the first time on the play and has risen at least 0.2 since the snap. Furthermore, we want to filter out plays where the throw already happened before that frame or where the quarterback was already out of the pocket.
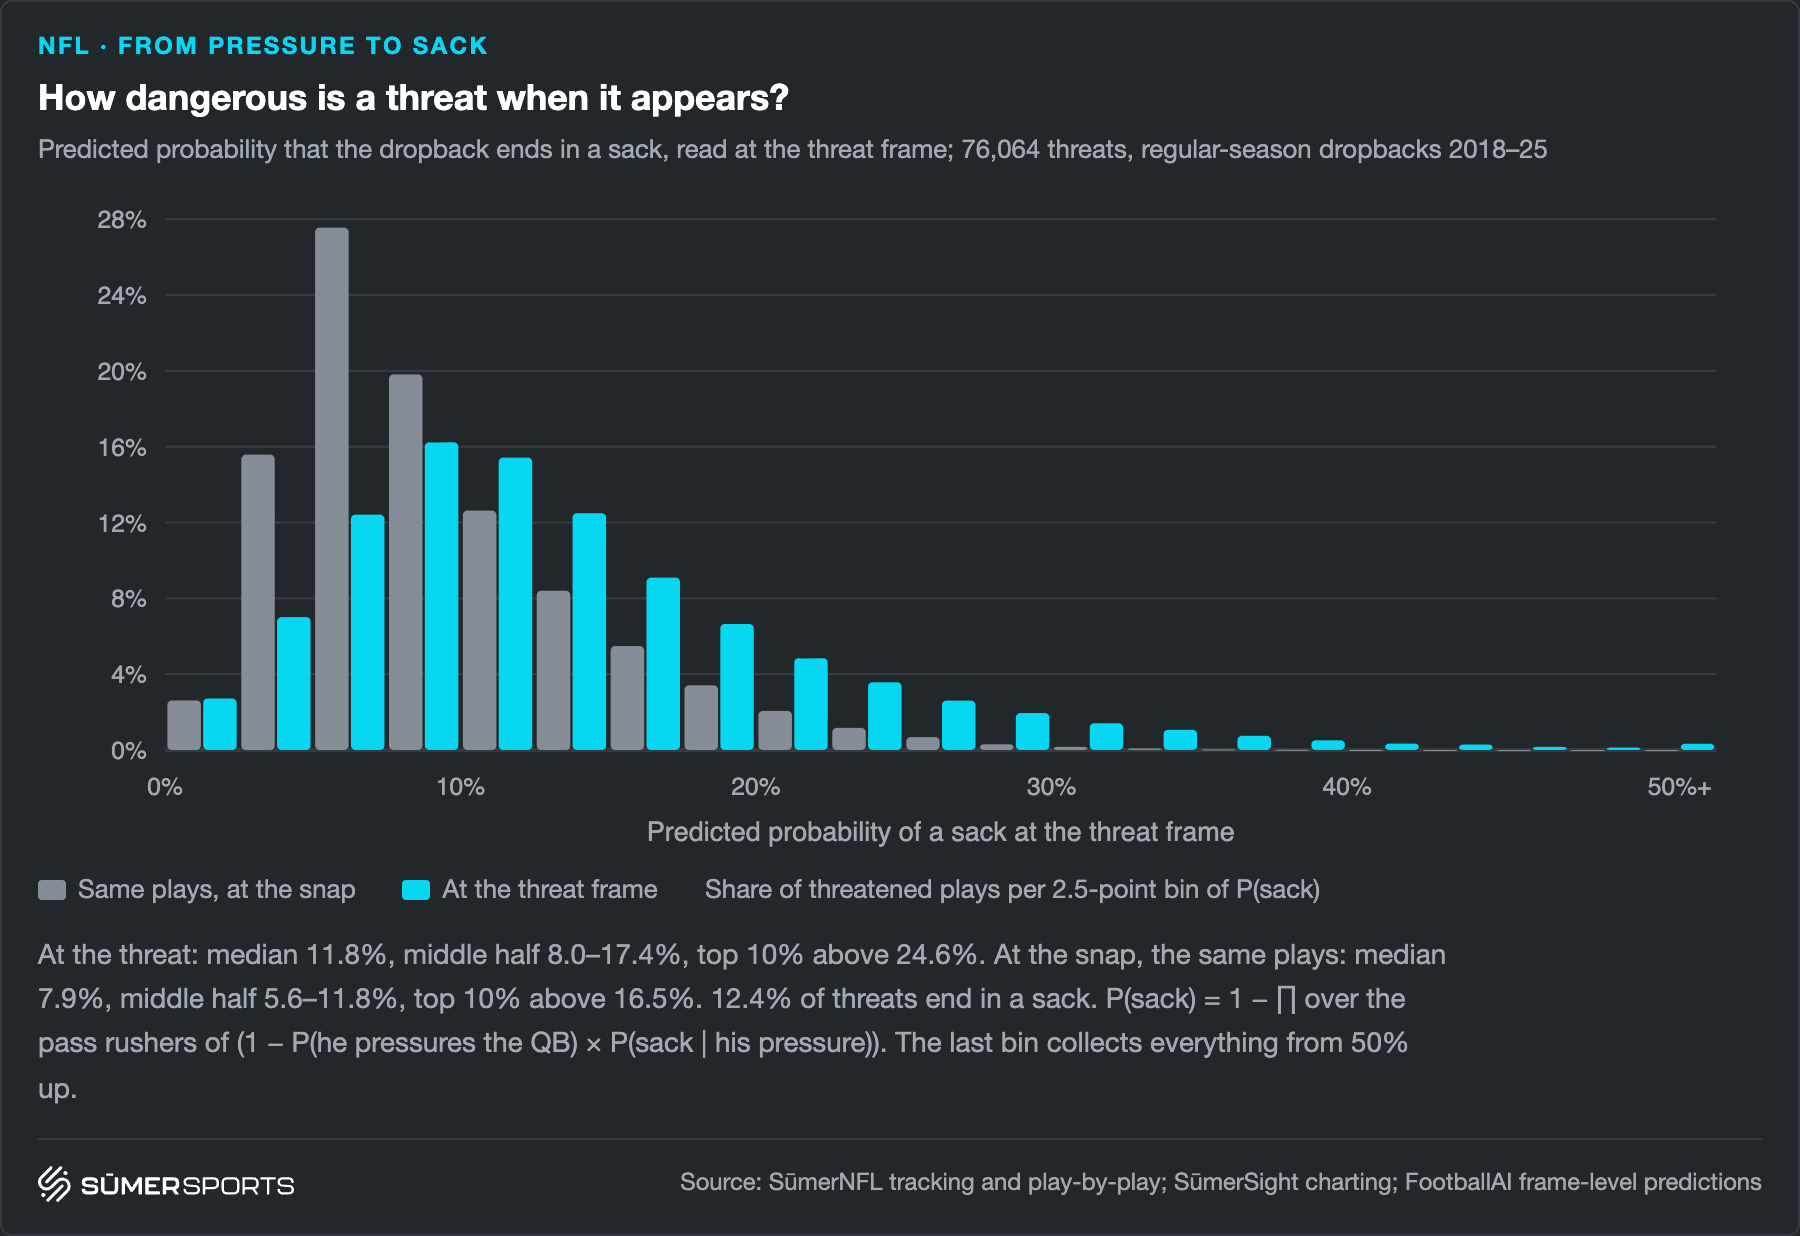
With our new threat definition, the distribution of the sack expectation at the threat looks more as expected: There is no leakage of whether the quarterback will release the ball, so the large weight at near 0% sack expectation is gone and instead it's an elevated sack expectation compared to the pre-snap baseline with a long right tail.
To study the behavior of quarterbacks, we differentiate between three categories of how a quarterback can react to a threat:
- Release the ball within 1 second after arrival of the threat.
- Hold the ball at least 1 second, stay in the pocket
- Hold the ball at least 1 second, leave the pocket
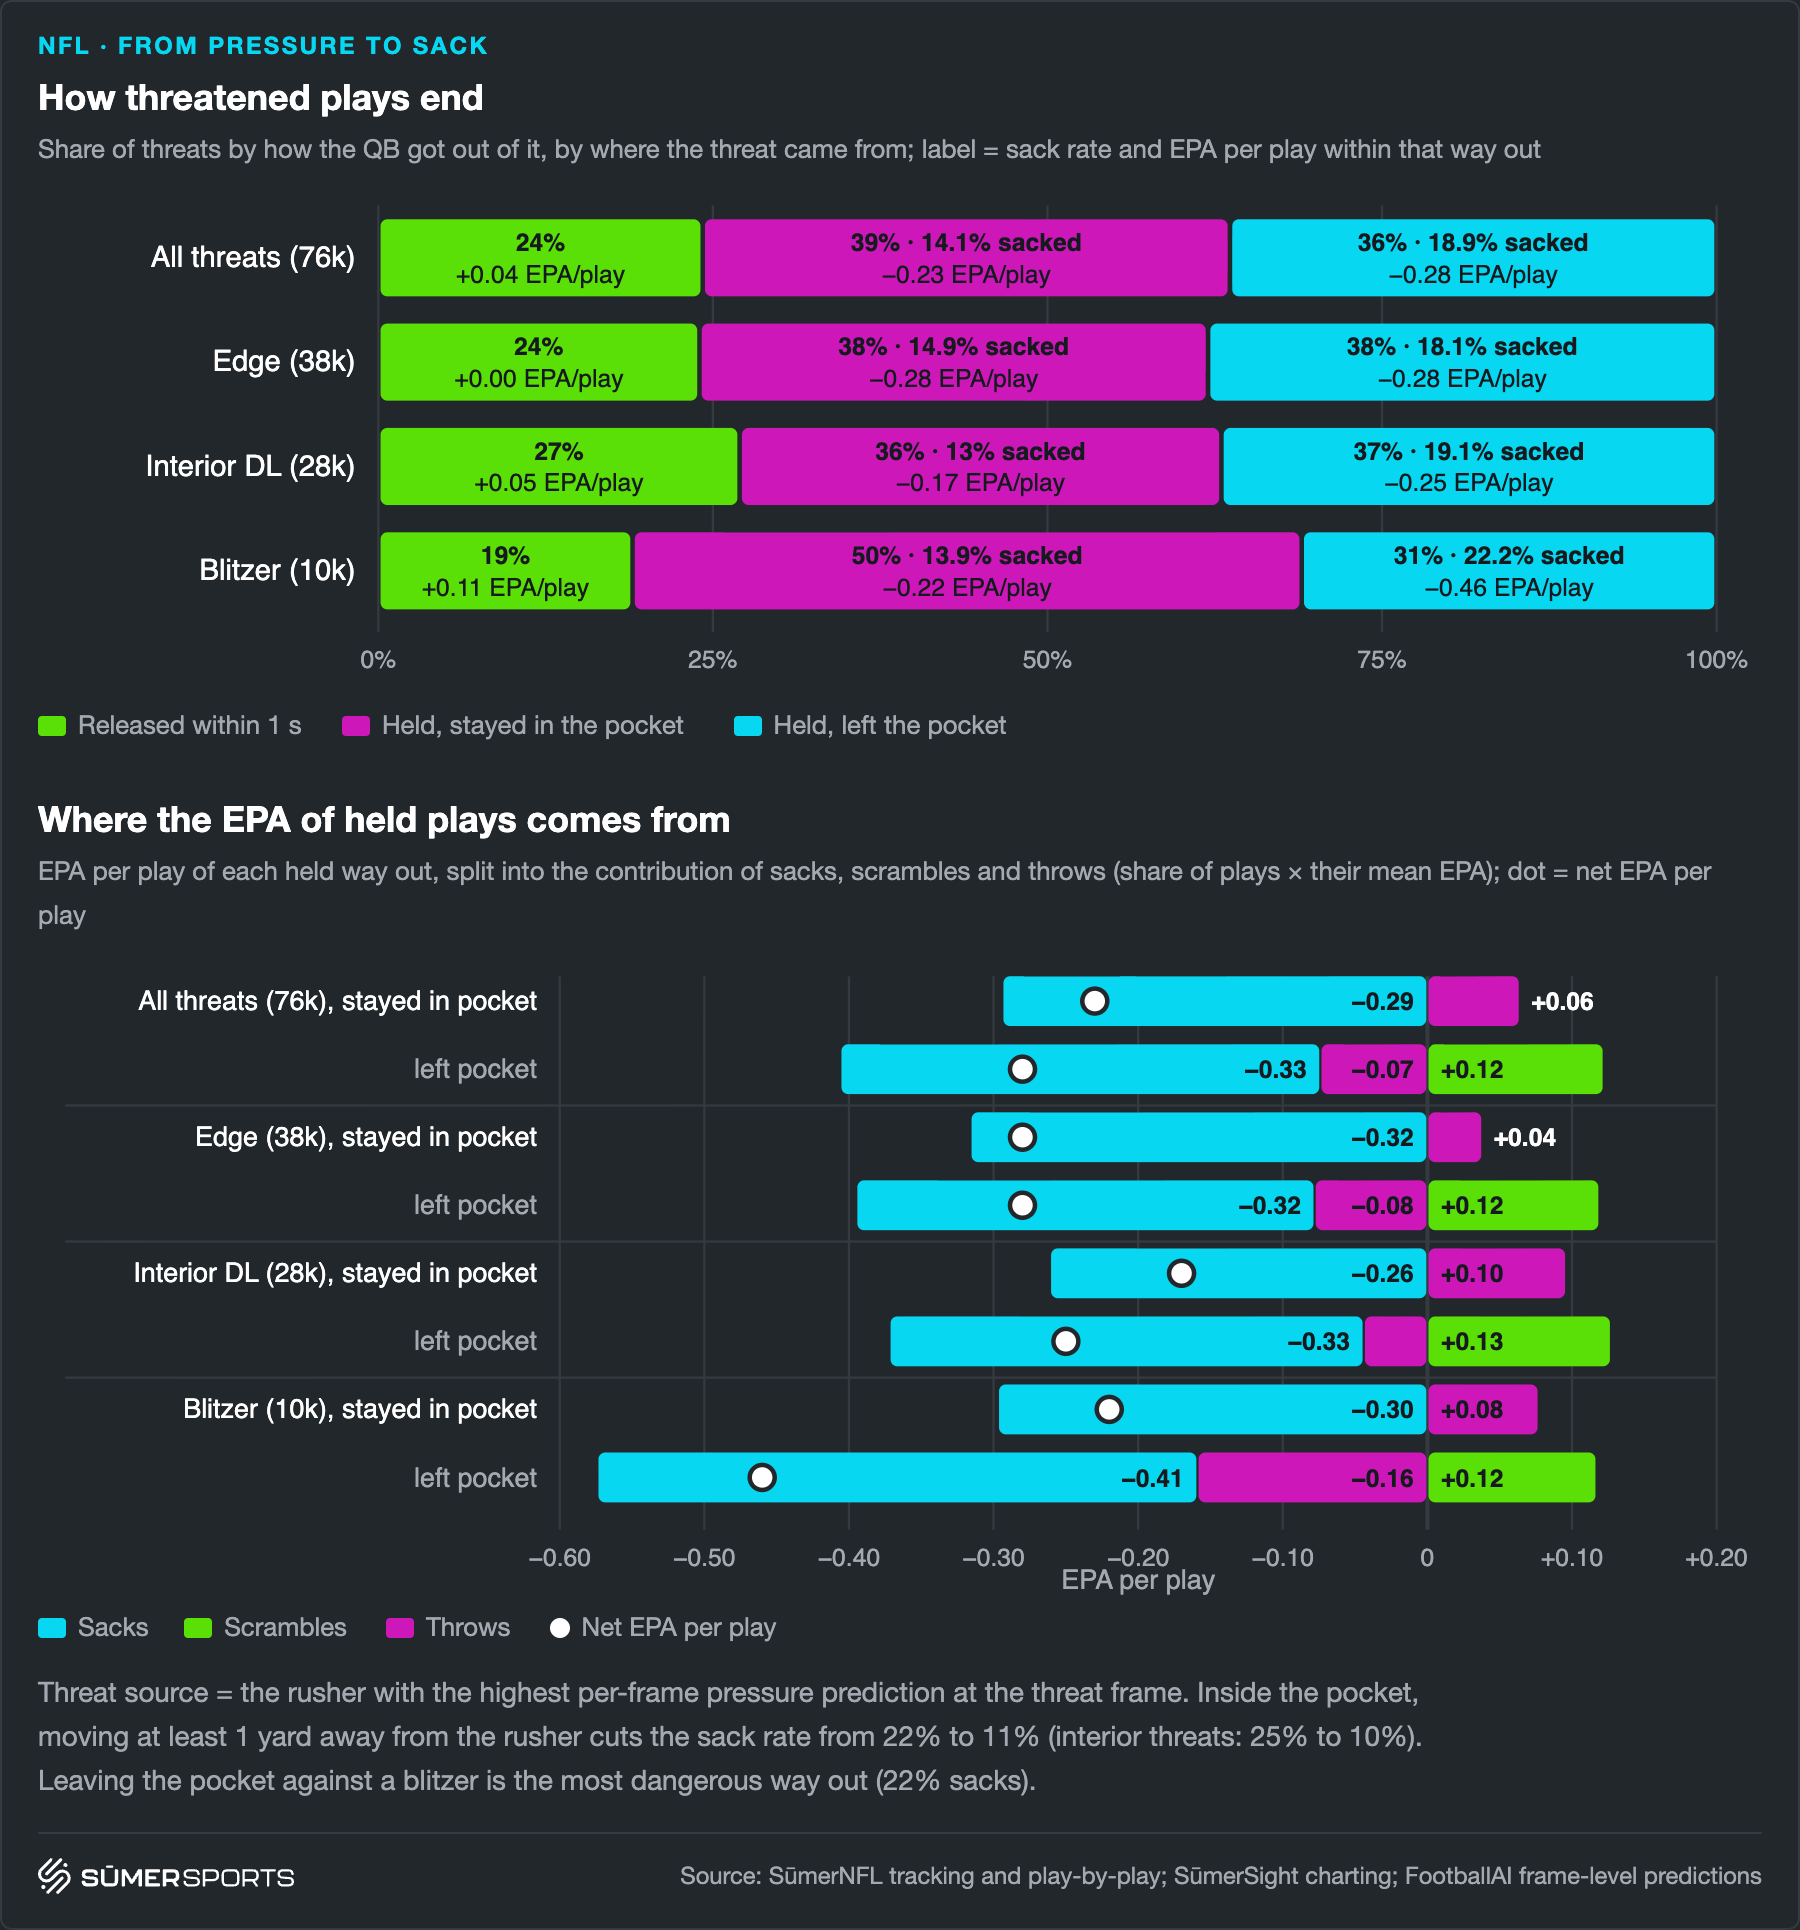
The following chart shows how often each of those reactions happens and how much EPA/play offenses generate in each branch.
The EPA/play on plays where the quarterbacks didn't release the ball within one second splits up into the contribution from sacks and the contribution from throws and scrambles.
When a quarterback holds the ball in the pocket and still gets a throw off, these throws are even slightly more efficient than quick releases. When leaving the pocket the positive contribution comes mostly from scrambles. Overall, the combined contribution from scrambles and throws outside the pocket is still slightly higher than quick releases. In summary, the entire negative effect when not releasing the ball is driven by sacks. This turns the ability to avoid sacks when not releasing the ball quickly into a very important trait and we will soon find that it's a stable trait for quarterbacks.
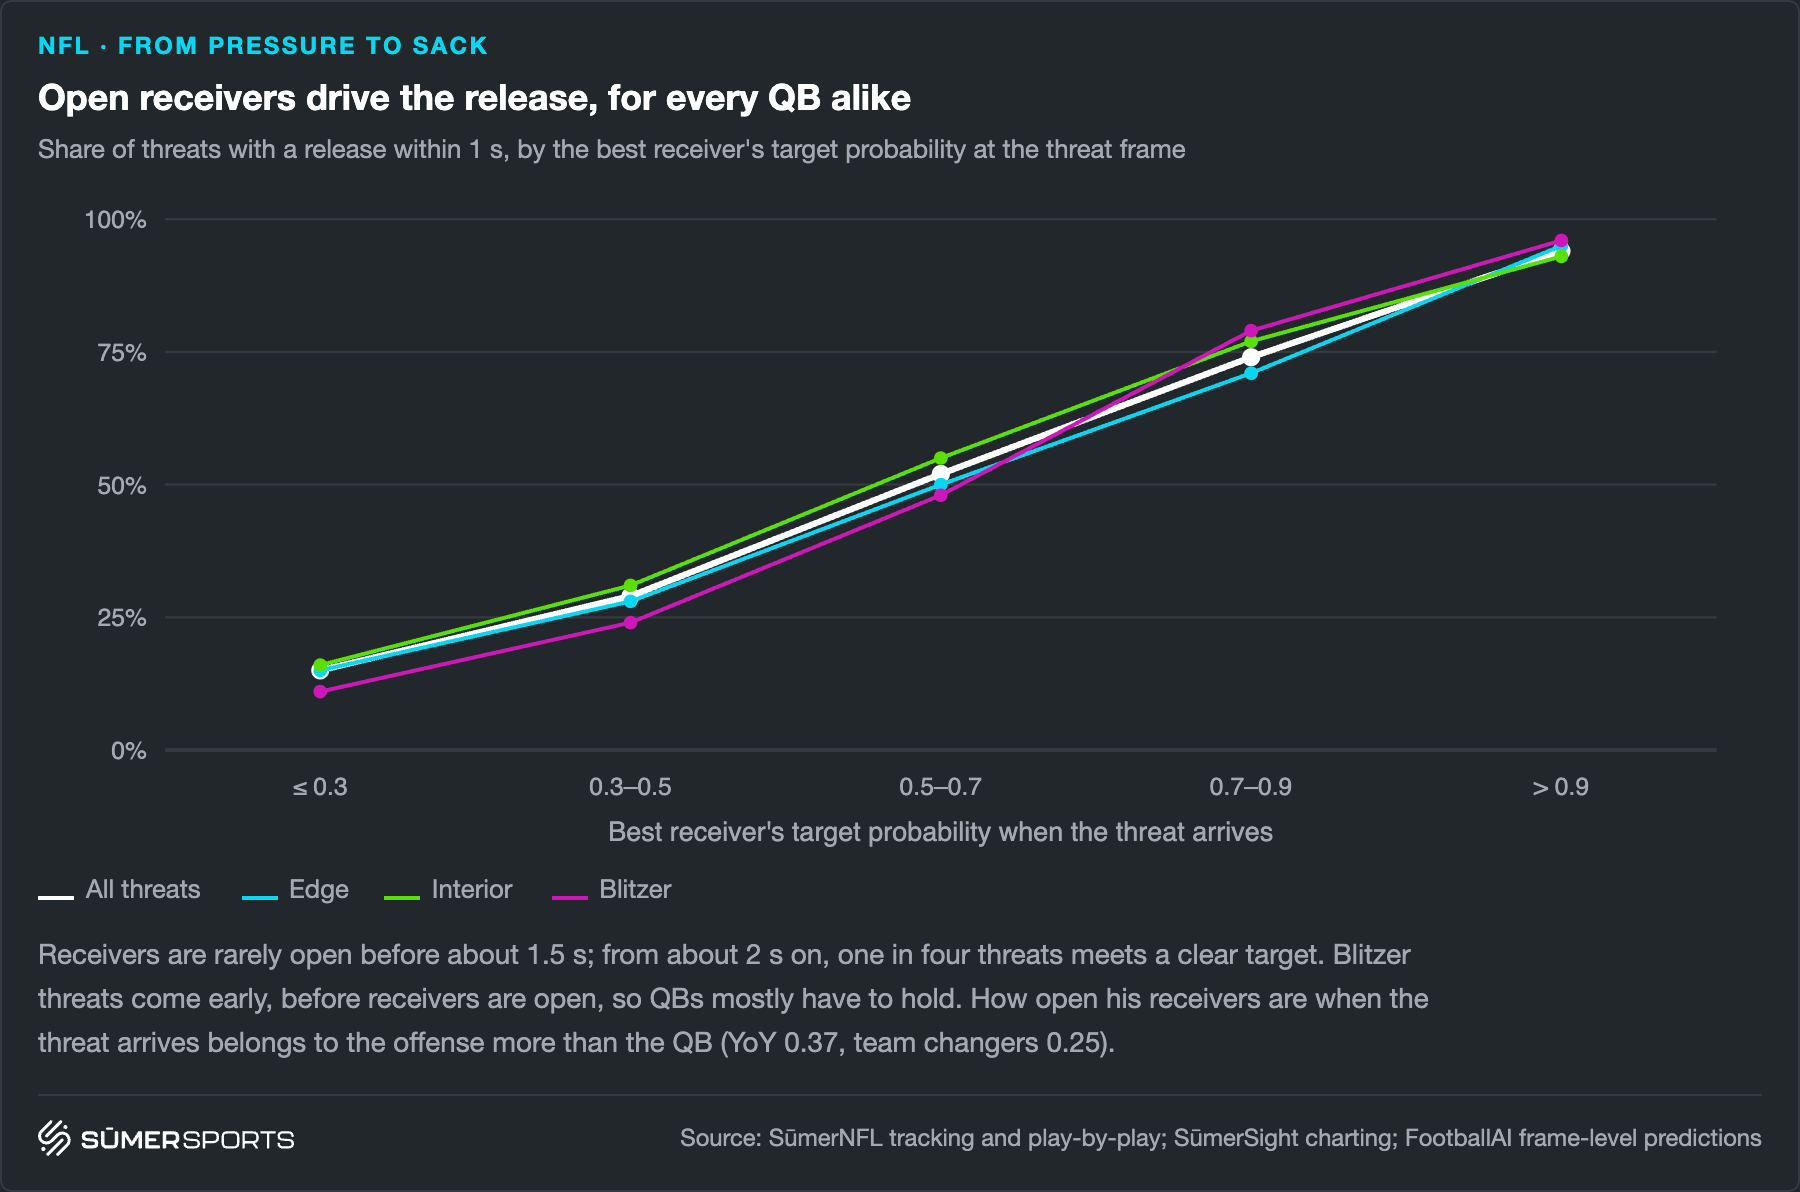
It's not surprising that releasing the ball within one second after a threat is the best option for a quarterback, but this obviously also depends on opportunity. The following chart shows how the highest measured target prediction for any receiver at the frame of threat arrival influences whether the quarterback can release the ball within one second.
The shape for threats from blitzers reflects the importance of a hot route: When there is a clear best target, this is most likely the hot route and quarterbacks find it more often than they would find receivers with comparable target predictions on other threats. However, when there is no clear best target, there is apparently no clear hot option and in this case, the quarterback becomes less likely to release the ball within one second compared to other threats.
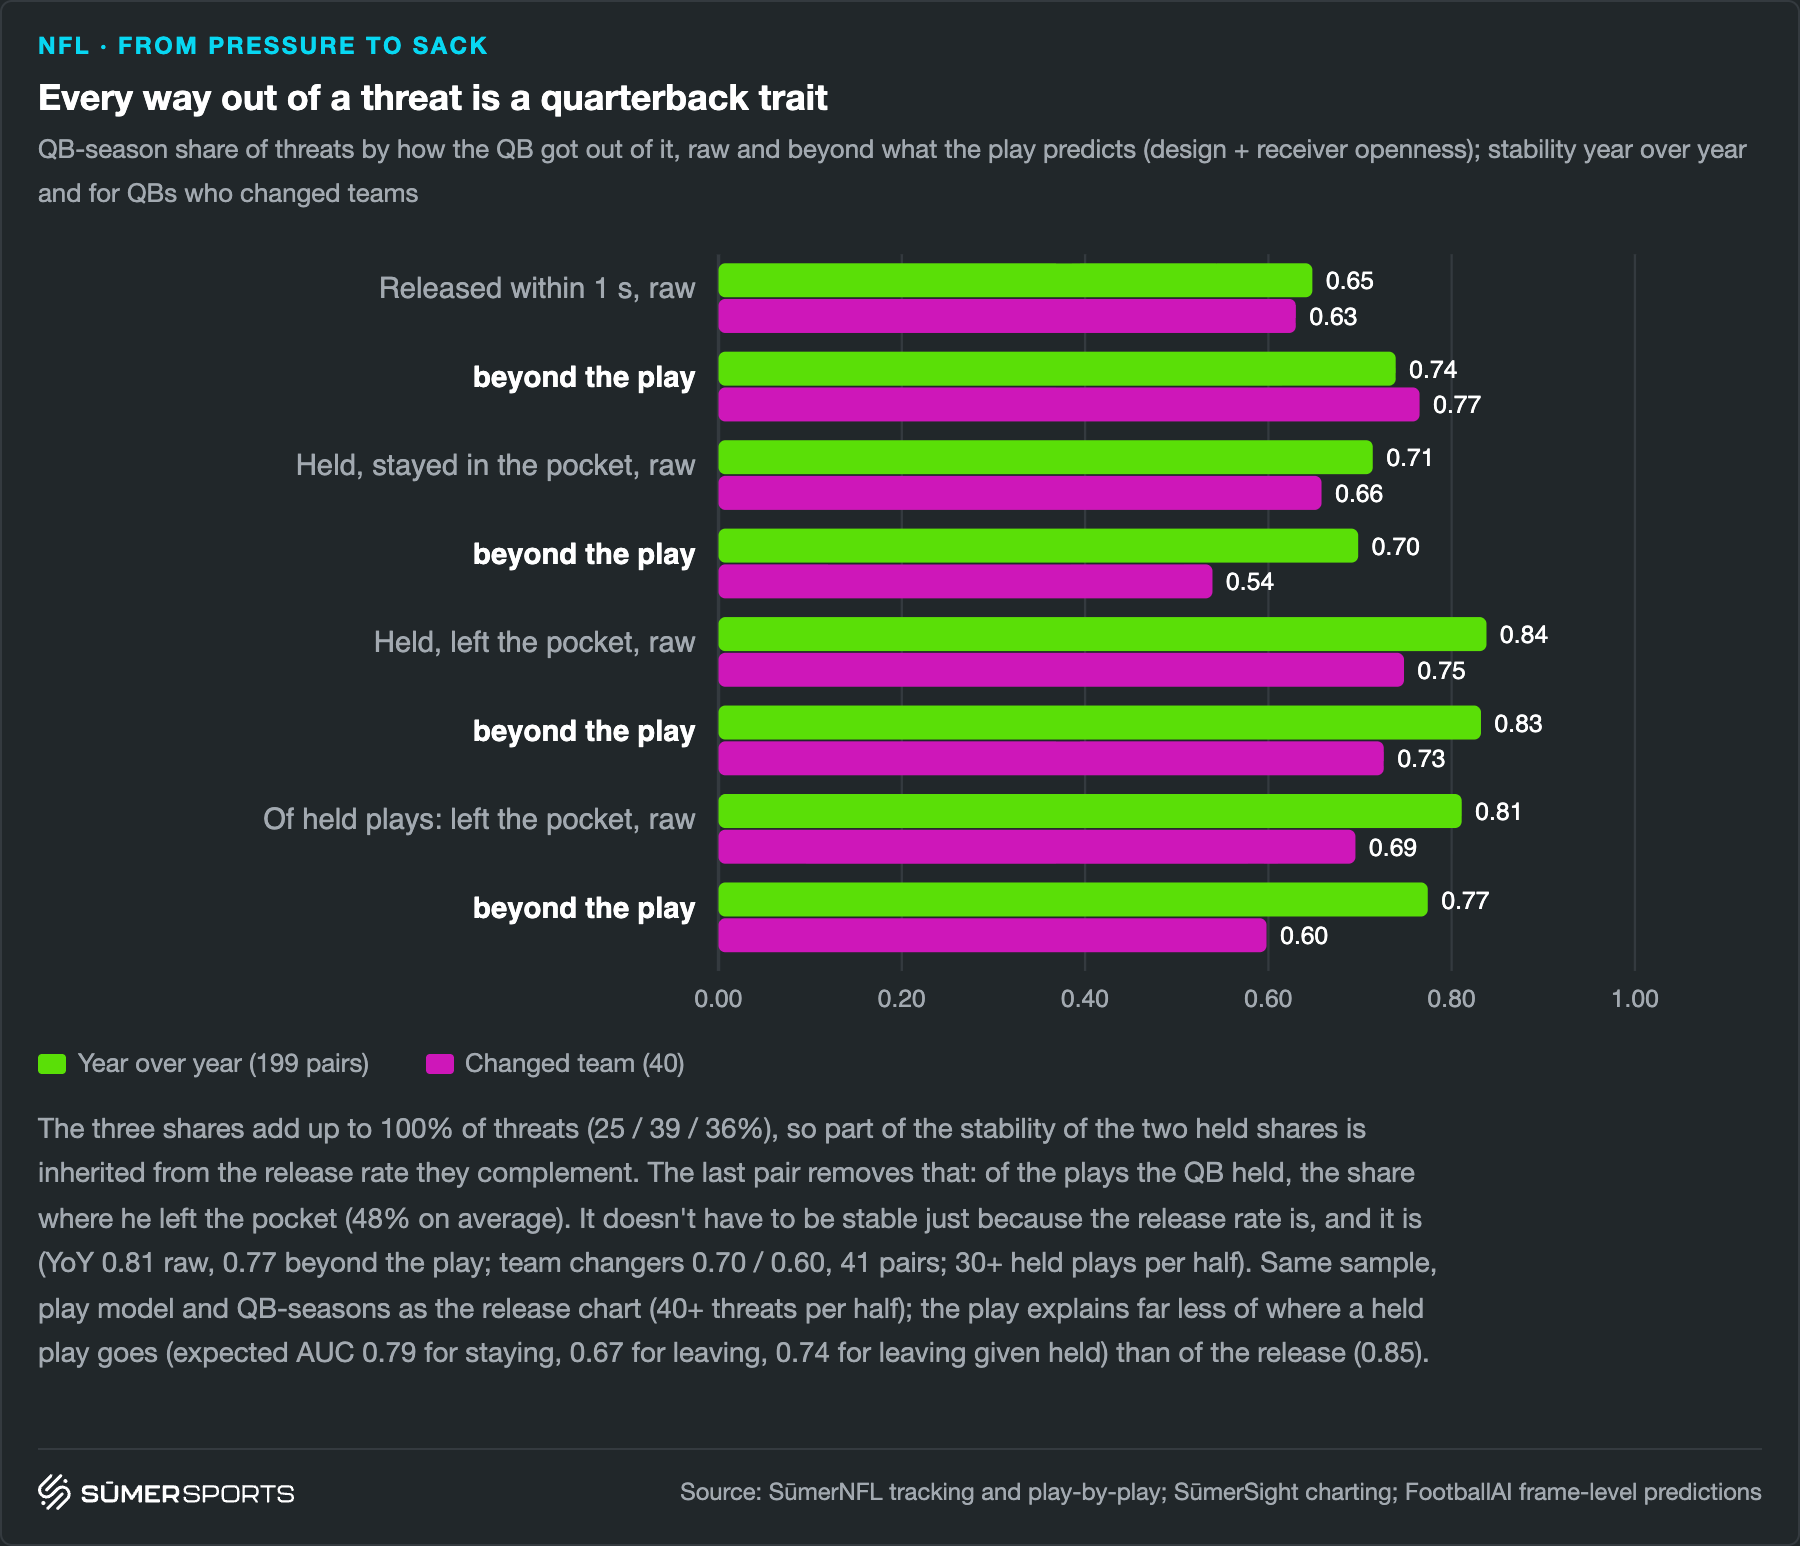
The fascinating result is that after accounting for play design and receiver openness (measured by the highest target prediction for any receiver), the release rate upon a threat becomes even more stable than its raw form. We find year-over-year stabilities of up to 0.74 and almost 0.8 for quarterbacks who changed teams.
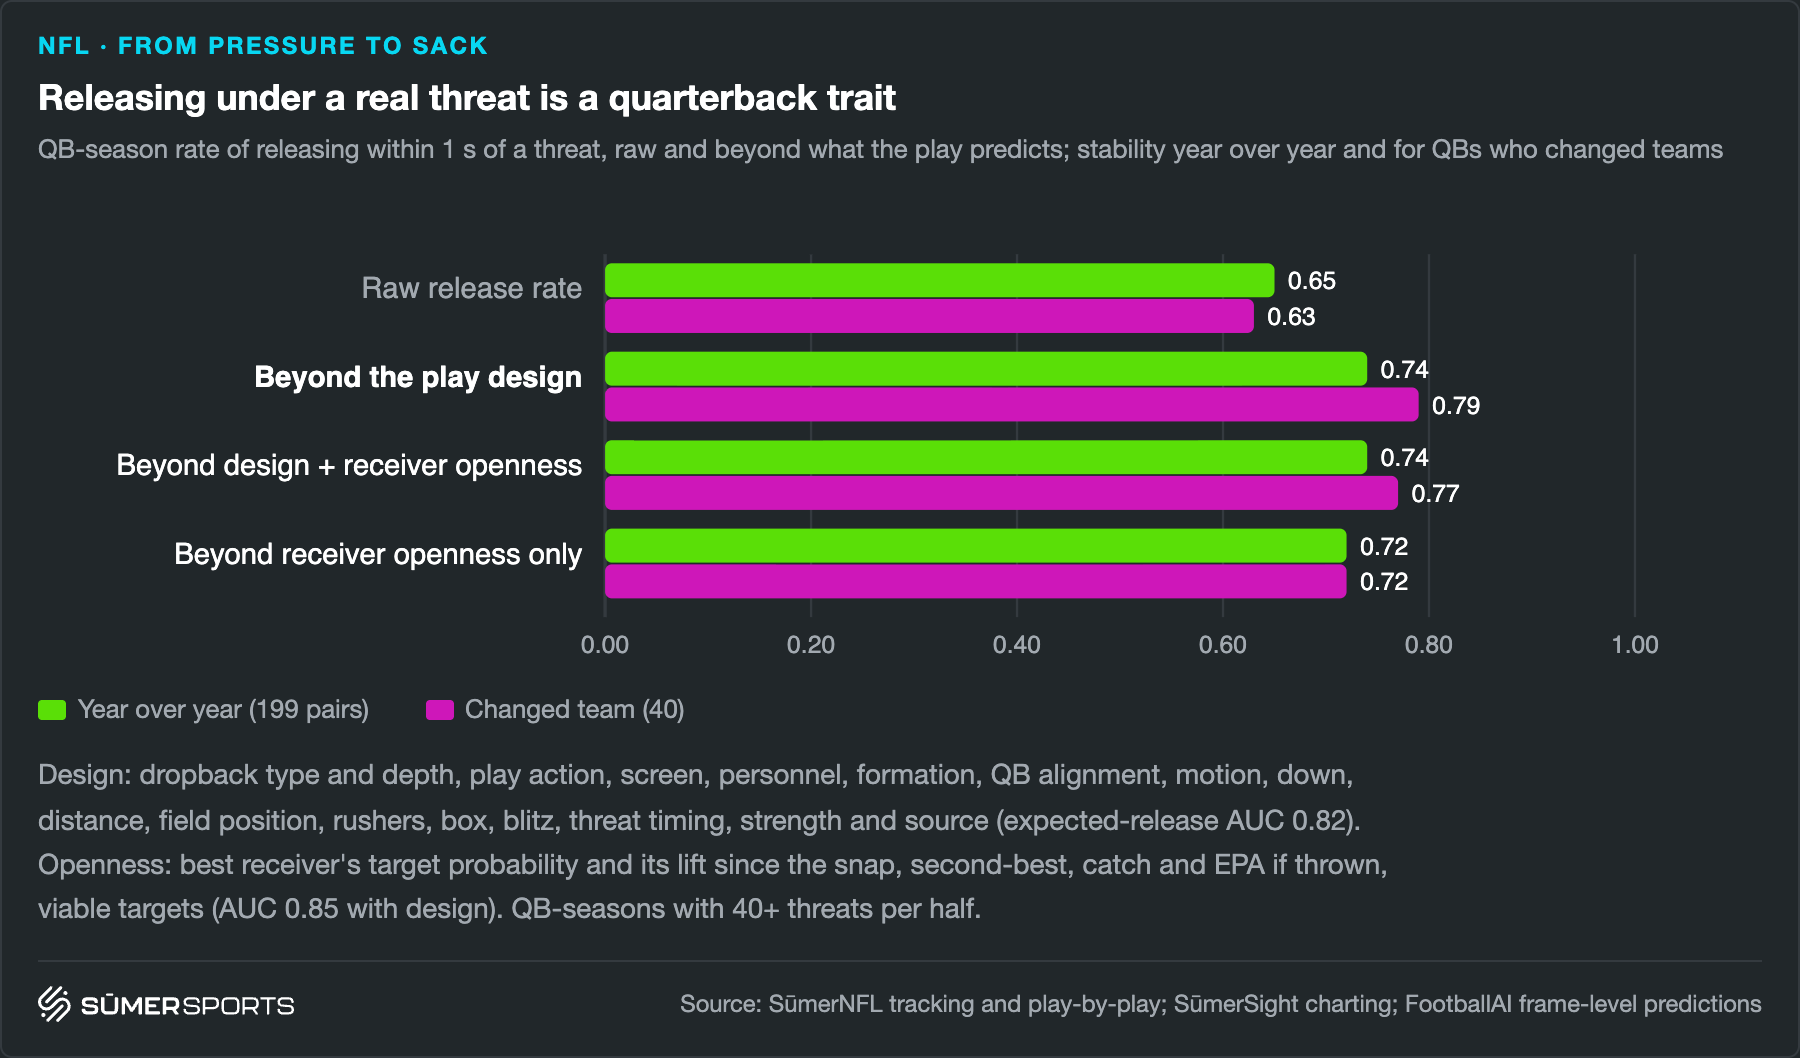
Whether a quarterback finds a target more often than expected based on the play design and openness at threat arrival is a very stable trait. The new finding is that this even holds after accounting for the opportunity. This is a sharper version of a known finding that wasn't possible without frame-level predictions.
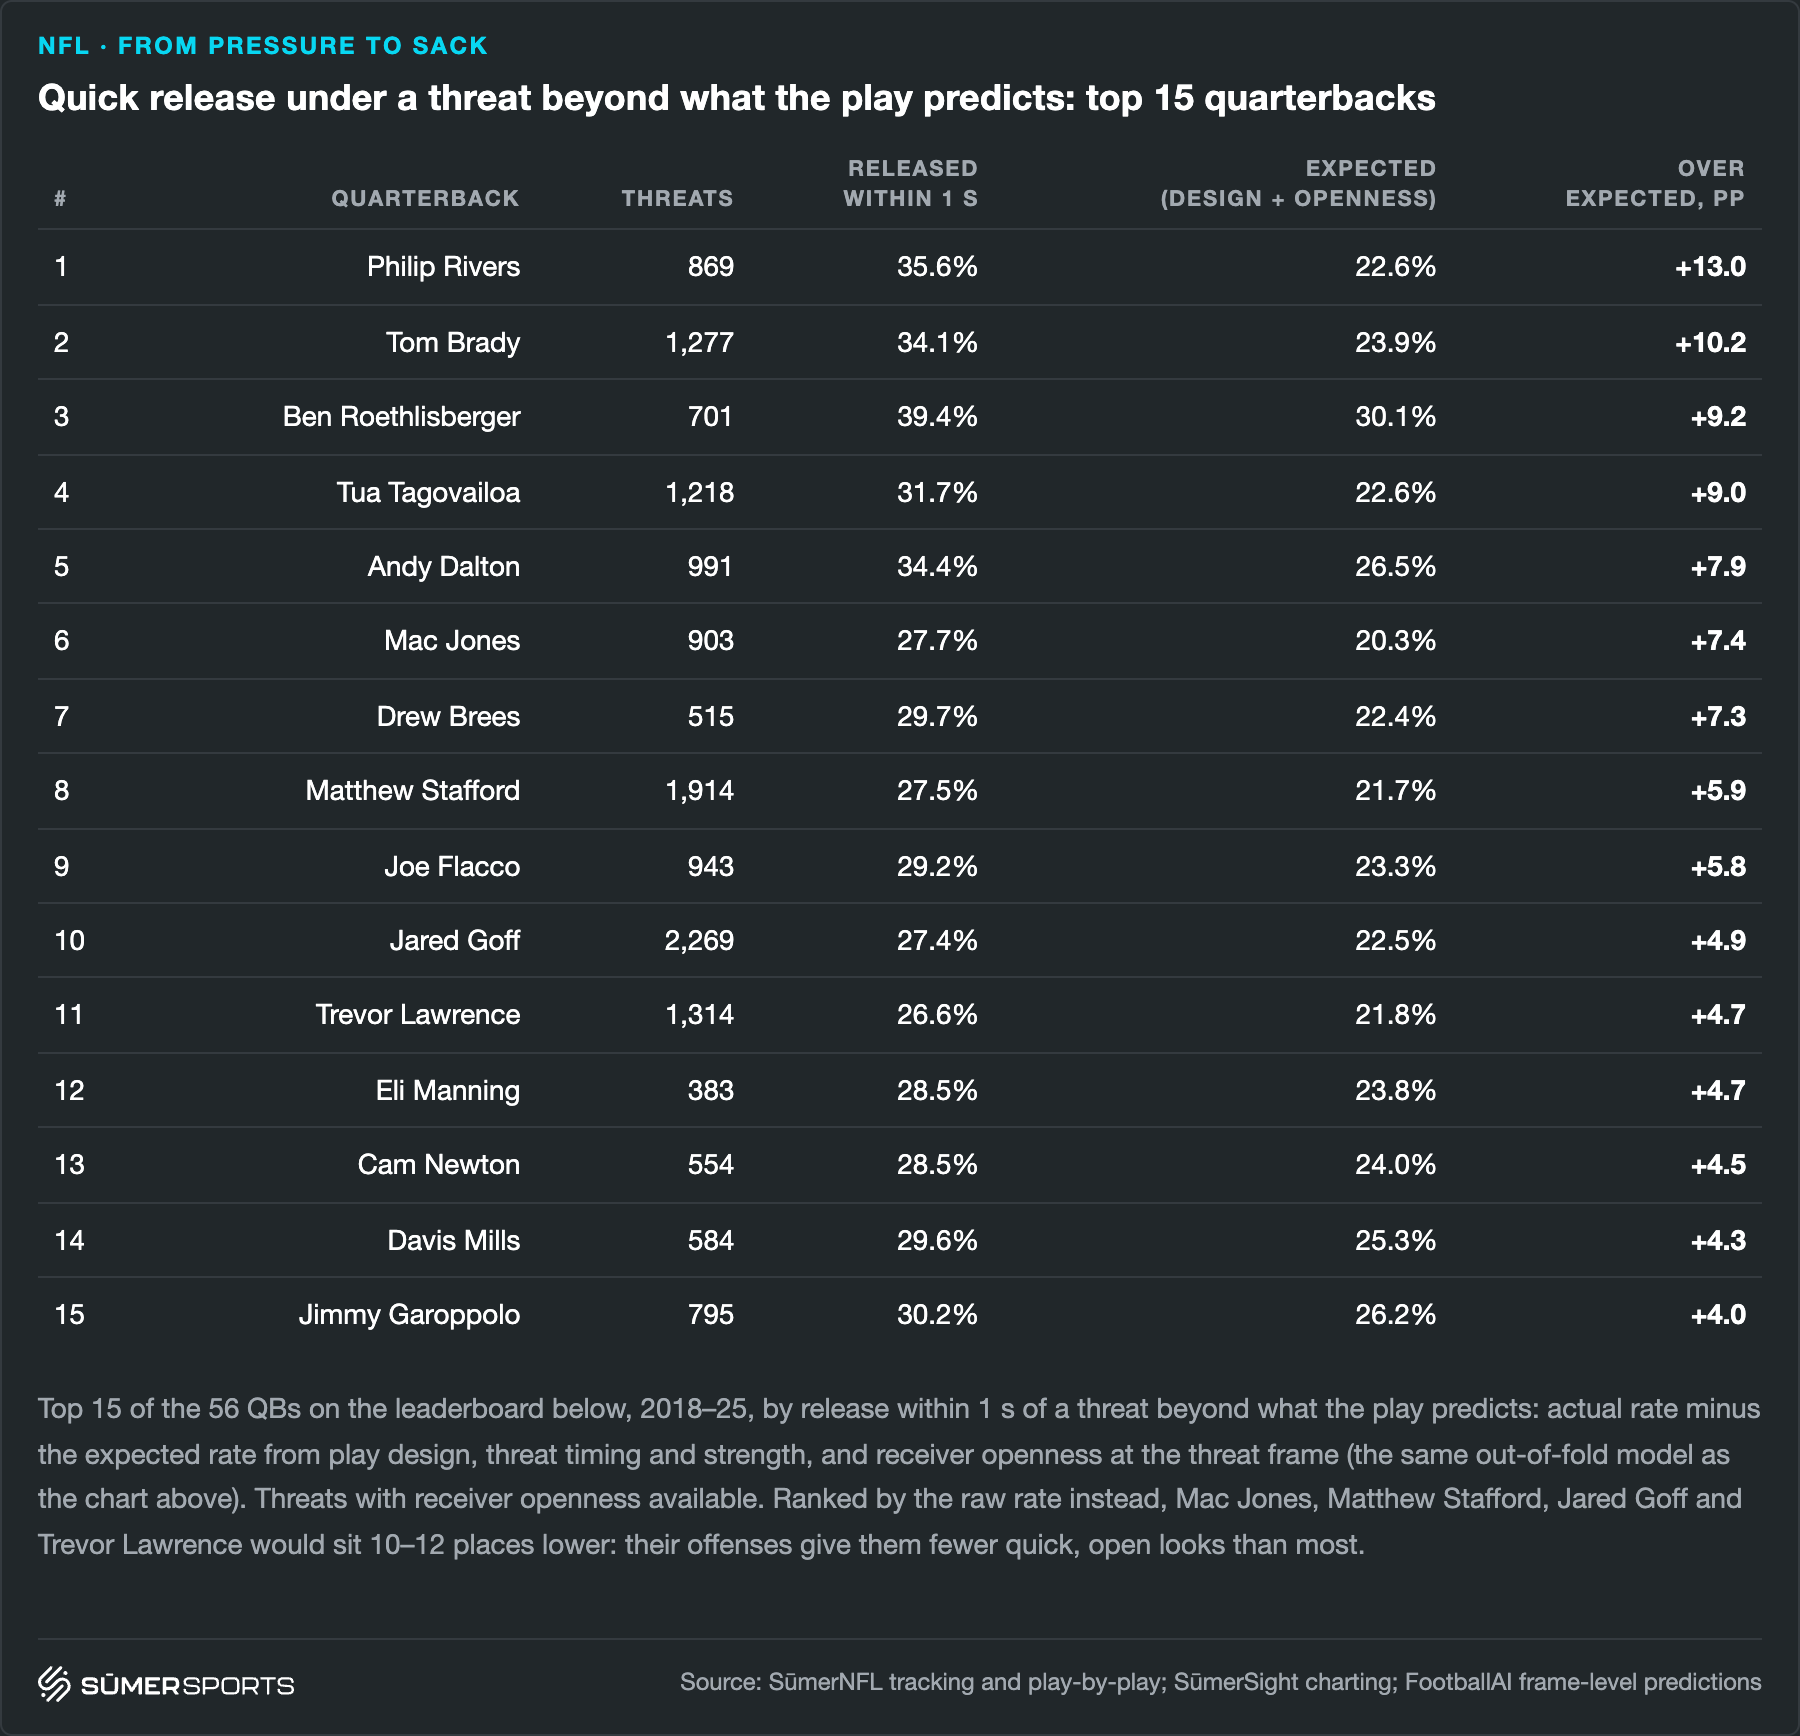
The following table shows the top 15 quarterbacks from 2018 through 2025 in terms of releasing the ball upon a threat after accounting for the opportunity. We call it hot release rate over expected. It's notable that Ben Roethlisberger had the highest raw release rate, but ranks below Philip Rivers and Tom Brady after accounting for design and openness. After taking a beating in his younger years, Roethlisberger wasn't all that interested in getting hit late in his career, so the offense was designed around quick releases.
Given the stability of the release rate, it's not surprising that we're finding that the other two reactions to a threat, that is holding the ball and staying in the pocket and holding the ball and leaving the pocket, are also very stable. Those three reactions add up to 100%, so they are inherently correlated.
However, it is a new finding that within the plays where the ball isn't released quickly after the threat, the ratio of staying in the pocket vs leaving the pocket is also very stable.
The behavior upon a threat partly explains performance, because releasing the ball gets the best results on average. Nevertheless, it describes style more than the quality of a quarterback.
That's why we want to test whether the performance in each of those branches is also a stable quarterback trait. Performance-related metrics are always noisier than style-related metrics and in this particular case, we also lower the sample sizes, since we look only at threats (roughly half of all plays) and then further divide these plays into three branches. Nevertheless, we find some decent stability numbers with one exception: What happens on quick release after the threat is hardly stable within the same season (from the first half to the second half of the season) and there is even zero correlation from one year to the next.
This can be interpreted as follows: the advantage of releasing the ball quickly upon a threat is simply that you can't take a sack and you give one of your skill players an opportunity to make a play. The skill is doing this to begin with, not being good at doing this.
Avoiding sacks once the ball is held is a stable quarterback trait; EPA on those plays is stable too, but it doesn't clearly travel with the QB when he changes teams.
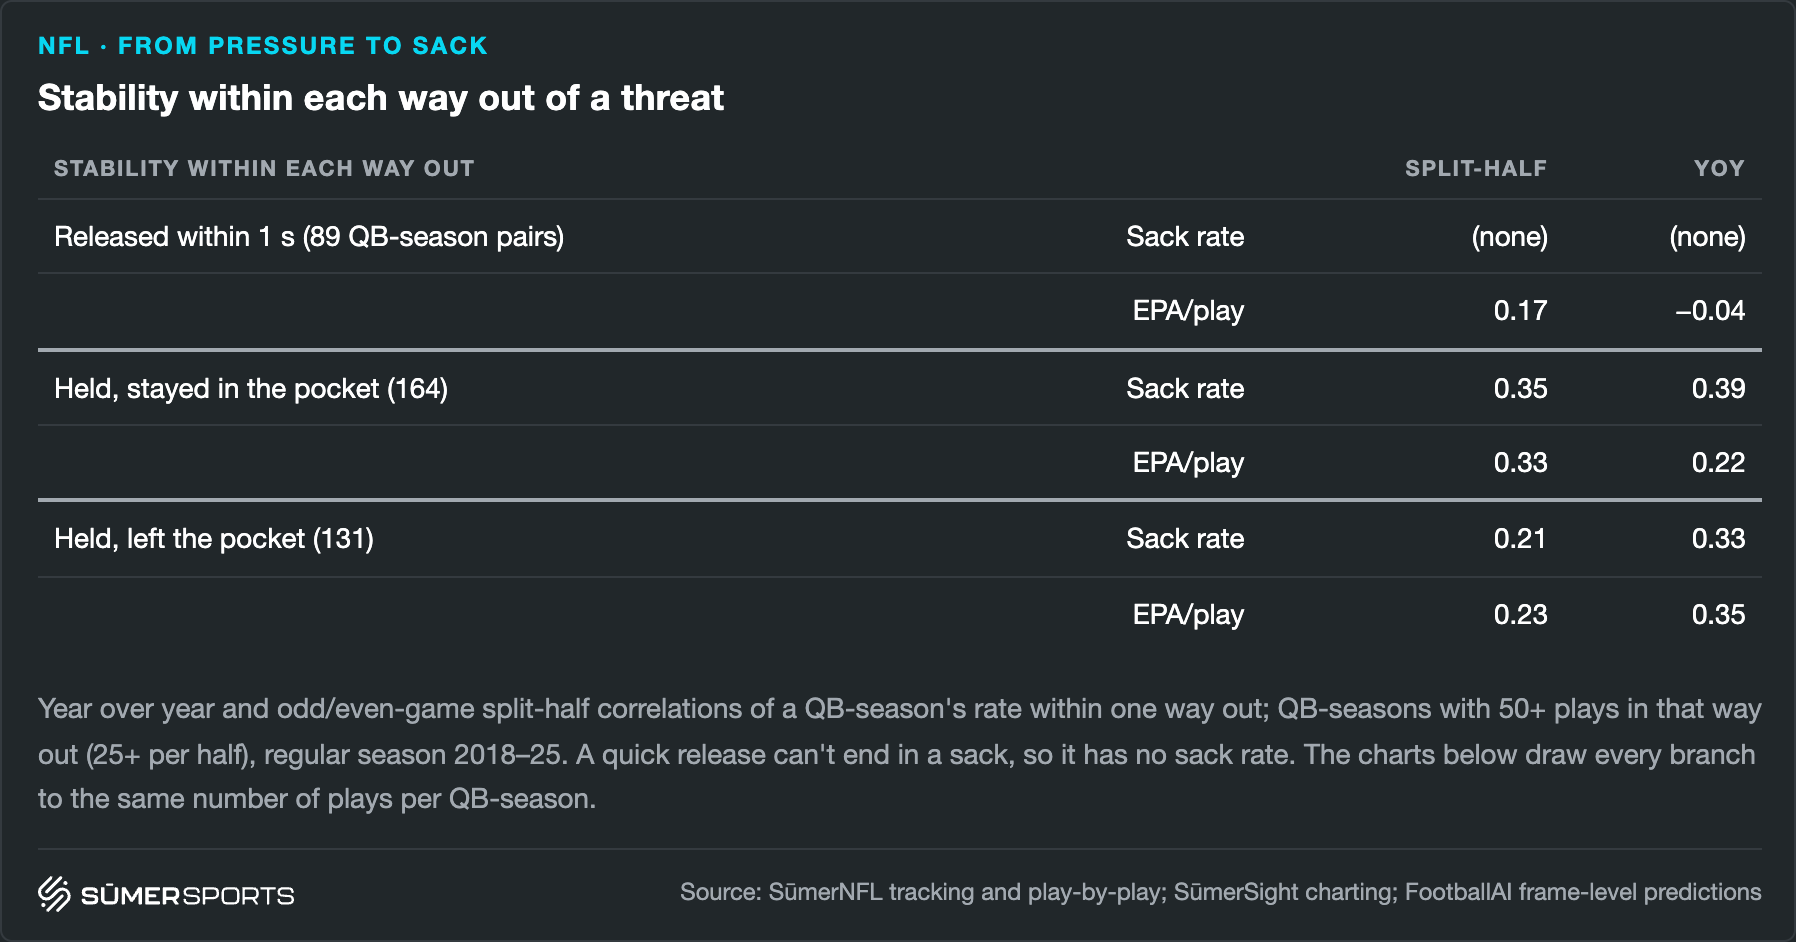
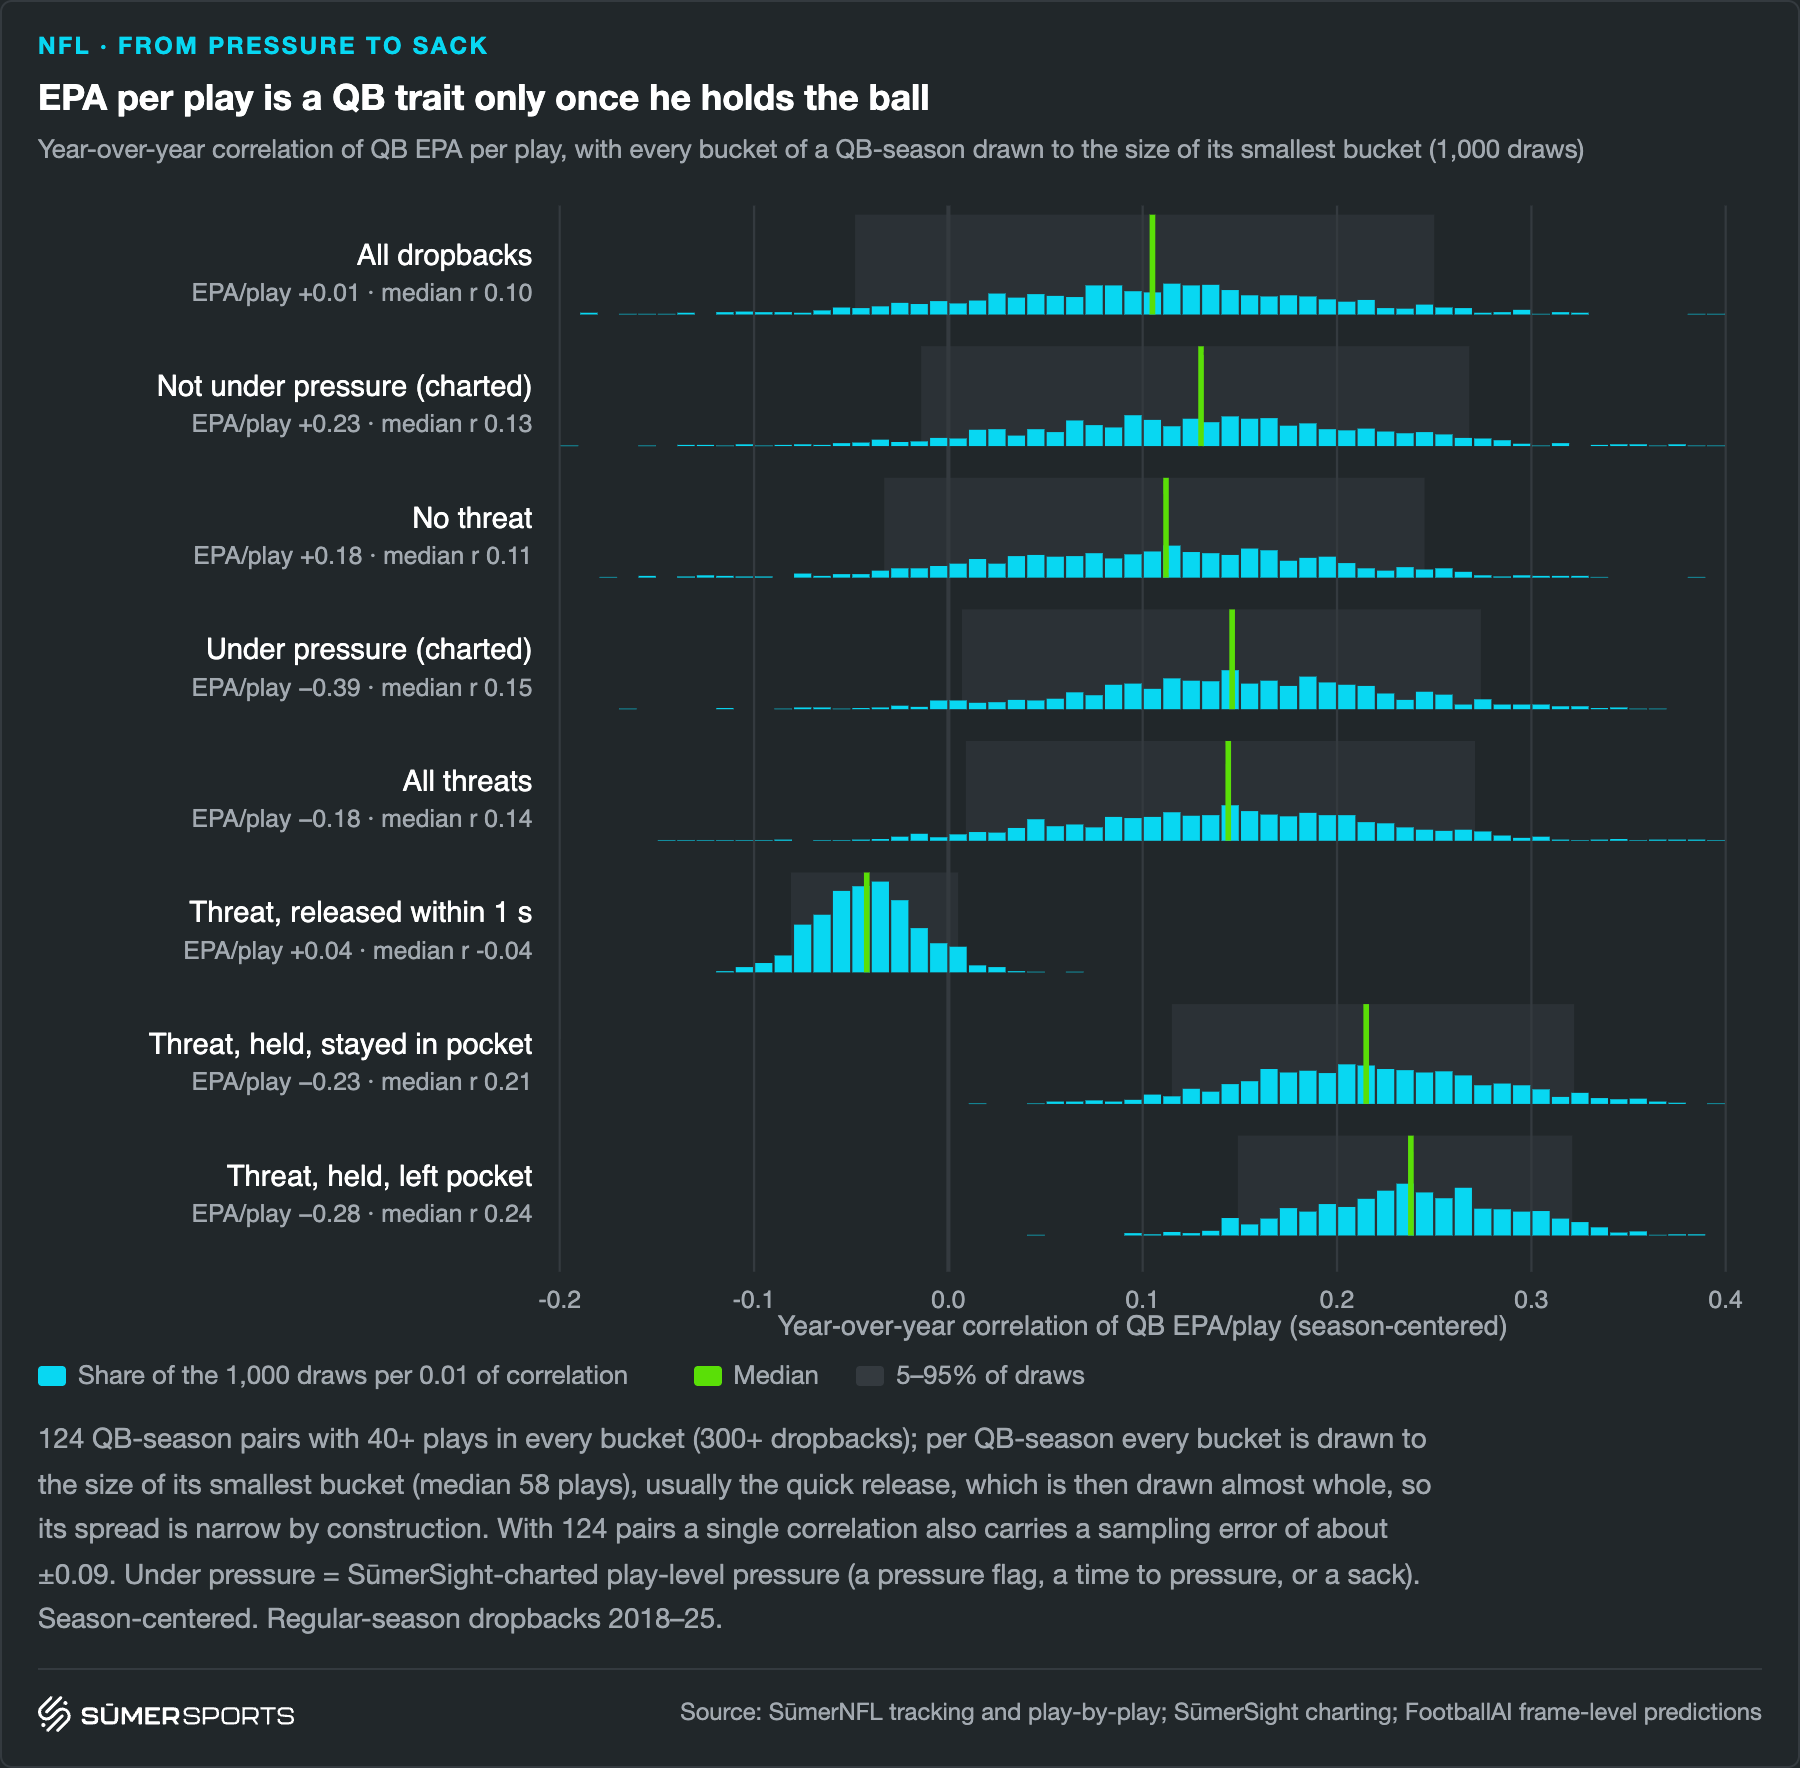
To further analyze this, we adjust the stability numbers for sample size, so that we can compare those to general stability numbers of sack rate and EPA/play on all dropbacks.
The following chart shows: A quarterback's production under a threat is at least as much in his control as his production when kept clean of any threat at all and the same holds for the conventional distinction by SūmerSight-charted pressure as well.
Once holding onto the ball under a threat, a quarterback's production is particularly stable and it's even higher when he leaves the pocket.
We can look at the same for sack rates and we're finding the same patterns: Once holding onto the ball upon a threat, whether a quarterback is sacked is more in his own control than on all plays.
It's also notable that the sack rate per threat is slightly more stable than the sack rate under pressure.
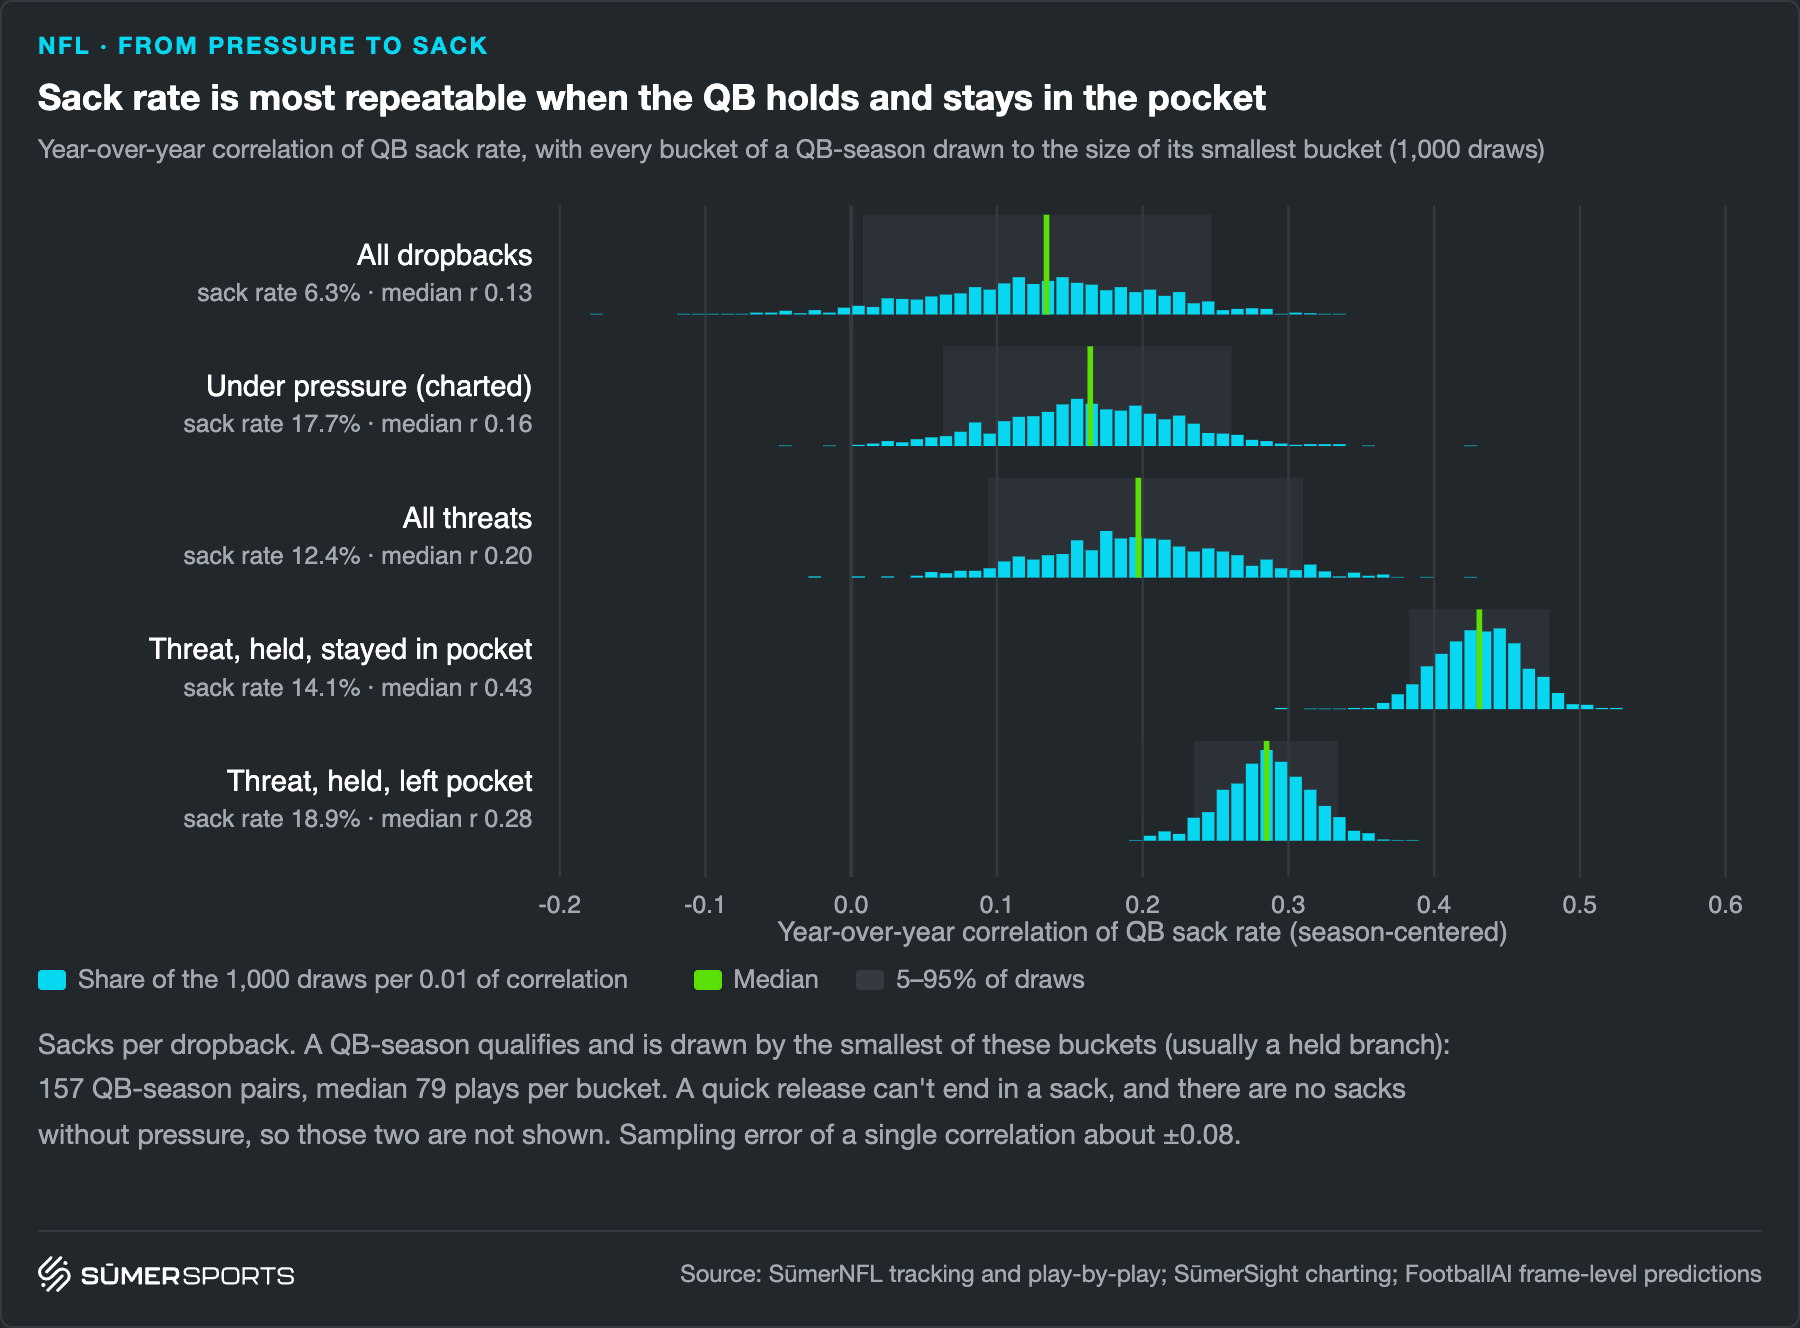
This is a finding that finally resolves a disconnect between analytics and watching film. In the past, the analytics finding has been that the performance under pressure is generally less stable, but that was because of two issues with the analysis:
- Pressured plays are just a smaller sample, so the raw stability will naturally be lower.
- Without frame-level analysis, we couldn't pin down the quarterback's behavior in a more detailed way.
When watching film, it seems apparent that some quarterbacks can create out of structure when the play breaks down because of a pressure threat much more than others and we've been able to explain this analytically now.
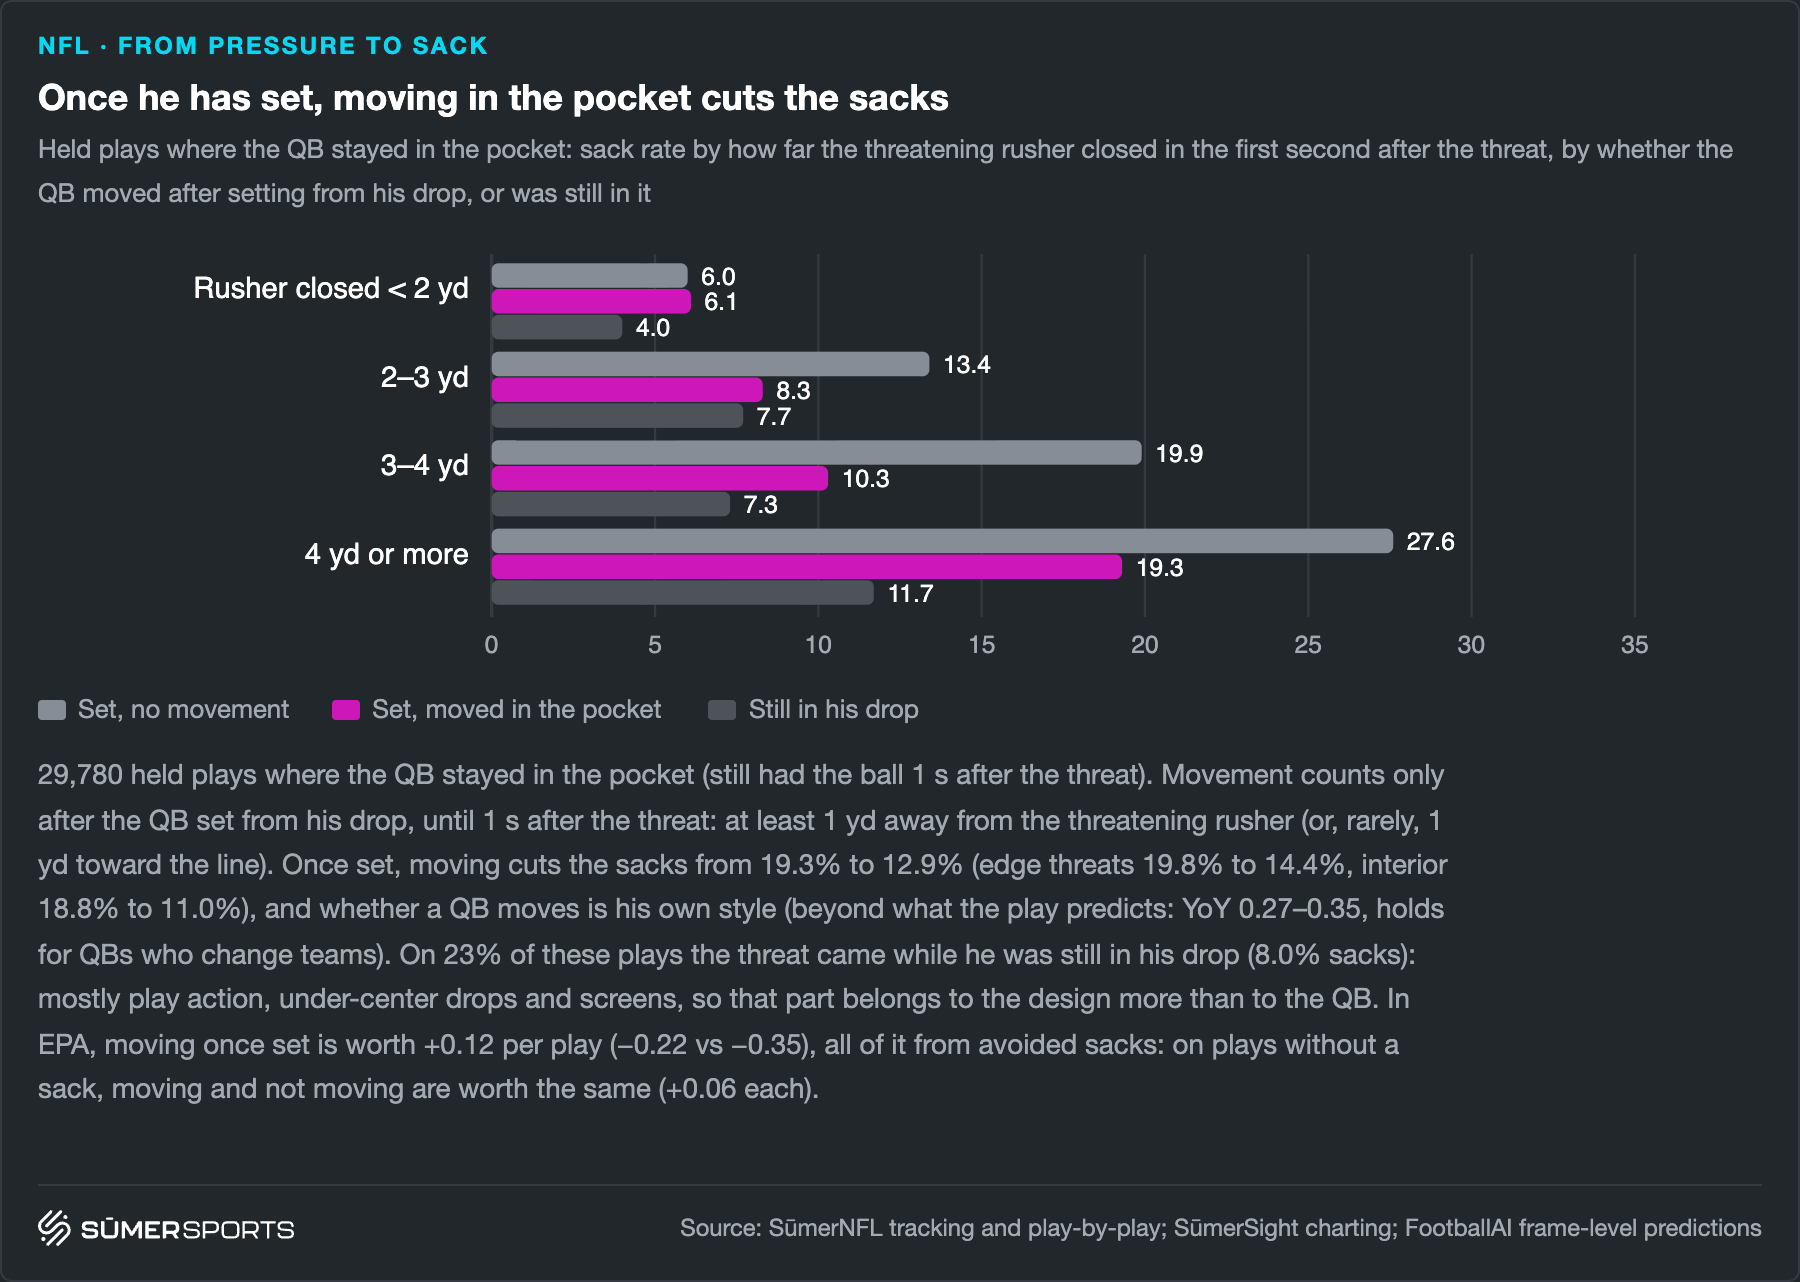
We can go one step further and separate the plays where a quarterback holds the ball and stays in the pocket upon a threat even more: By whether he was still in his drop when the threat arrived and when that's not the case, we can separate into pocket movement or standing still (which usually means the QB is either confident that he will be able to release it quickly enough or he is blind to the threat).
Pocket movement unsurprisingly helps reduce sacks and is more impactful the more the threat developed into a concrete danger (measured by how much the rusher closed towards the QB after the threat frame).
Within the plays where the quarterback holds the ball after the threat and is already out of his initial drop, the rate at which a quarterback reacts to the rusher with pocket movement is fairly stable from year to year: The correlation is 0.27, which is a fairly high number for such a low sample size.
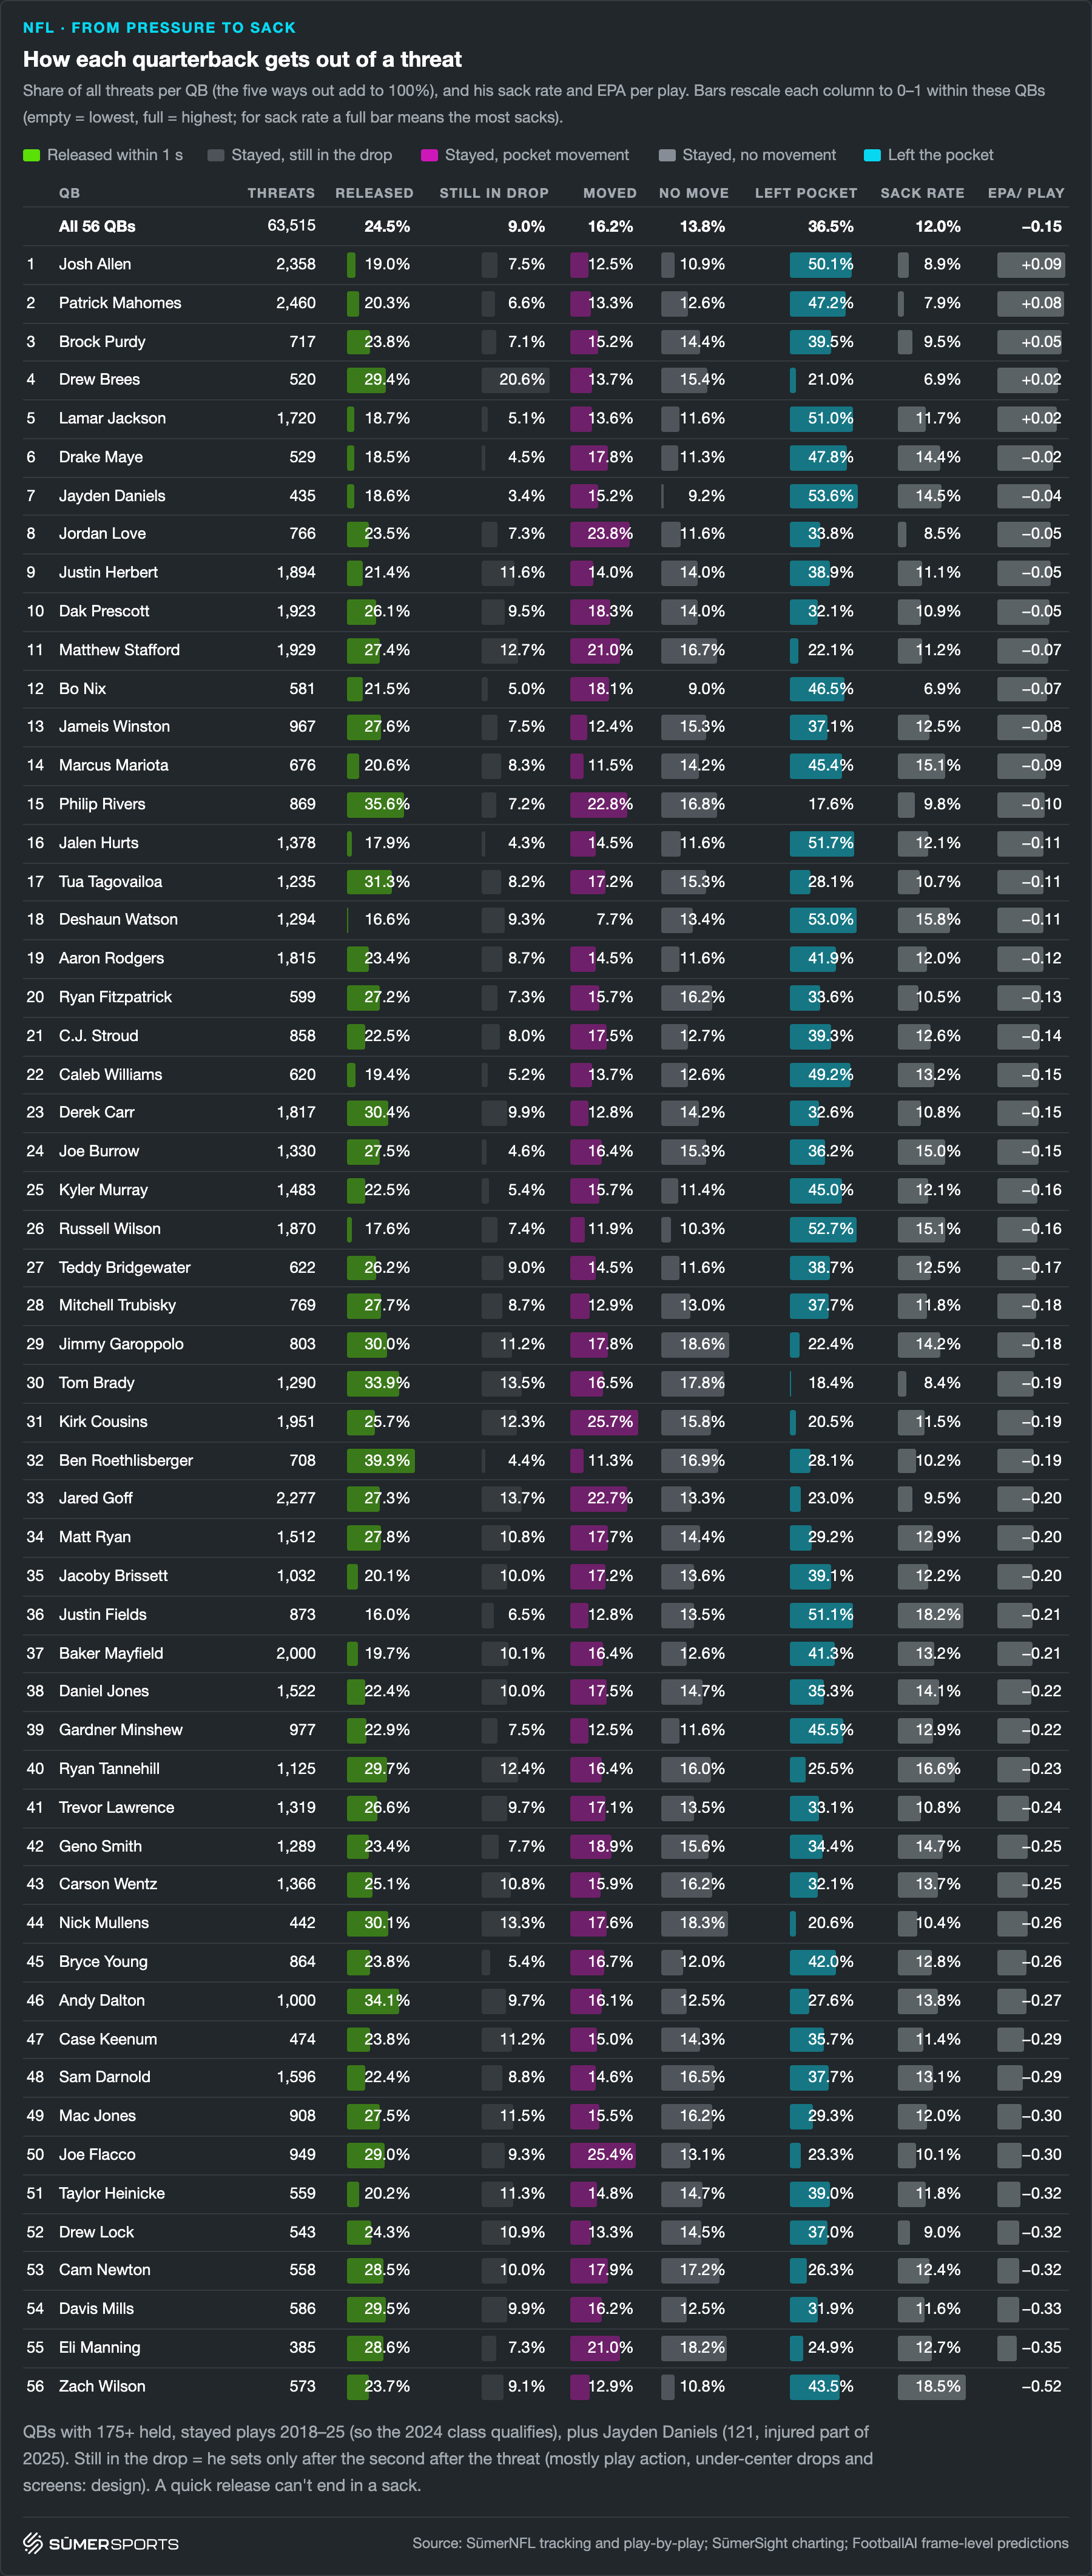
At last, here is a full list of 56 quarterbacks from 2018 through 2025: how they reacted to threats and how they performed under threats, both on all threats, but also in each of the three behavior branches. The qualifying threshold is chosen such that the full-time starters of the 2024 QB class including Caleb Williams, Drake Maye and Bo Nix are above the cut. We additionally included Jayden Daniels.
When looking at the quarterbacks with the lowest sack rates, we find a mixture of types: older, already retired quarterbacks who mostly avoid sacks by releasing the ball and not leaving the pocket, such as Drew Brees and Tom Brady. Another cluster are quarterbacks who avoid sacks by leaving the pocket, such as Bo Nix, Patrick Mahomes and Josh Allen. Jordan Love is a quarterback who avoids sacks with good pocket movement, but he has shown that he can also leave the pocket if necessary.
When looking at quarterbacks with the highest EPA/play on threats, it's notable that five of the highest seven quarterbacks rank highly in the rate at which they leave the pocket. This reinforces the importance of our finding that performing in these circumstances is a real quarterback skill.
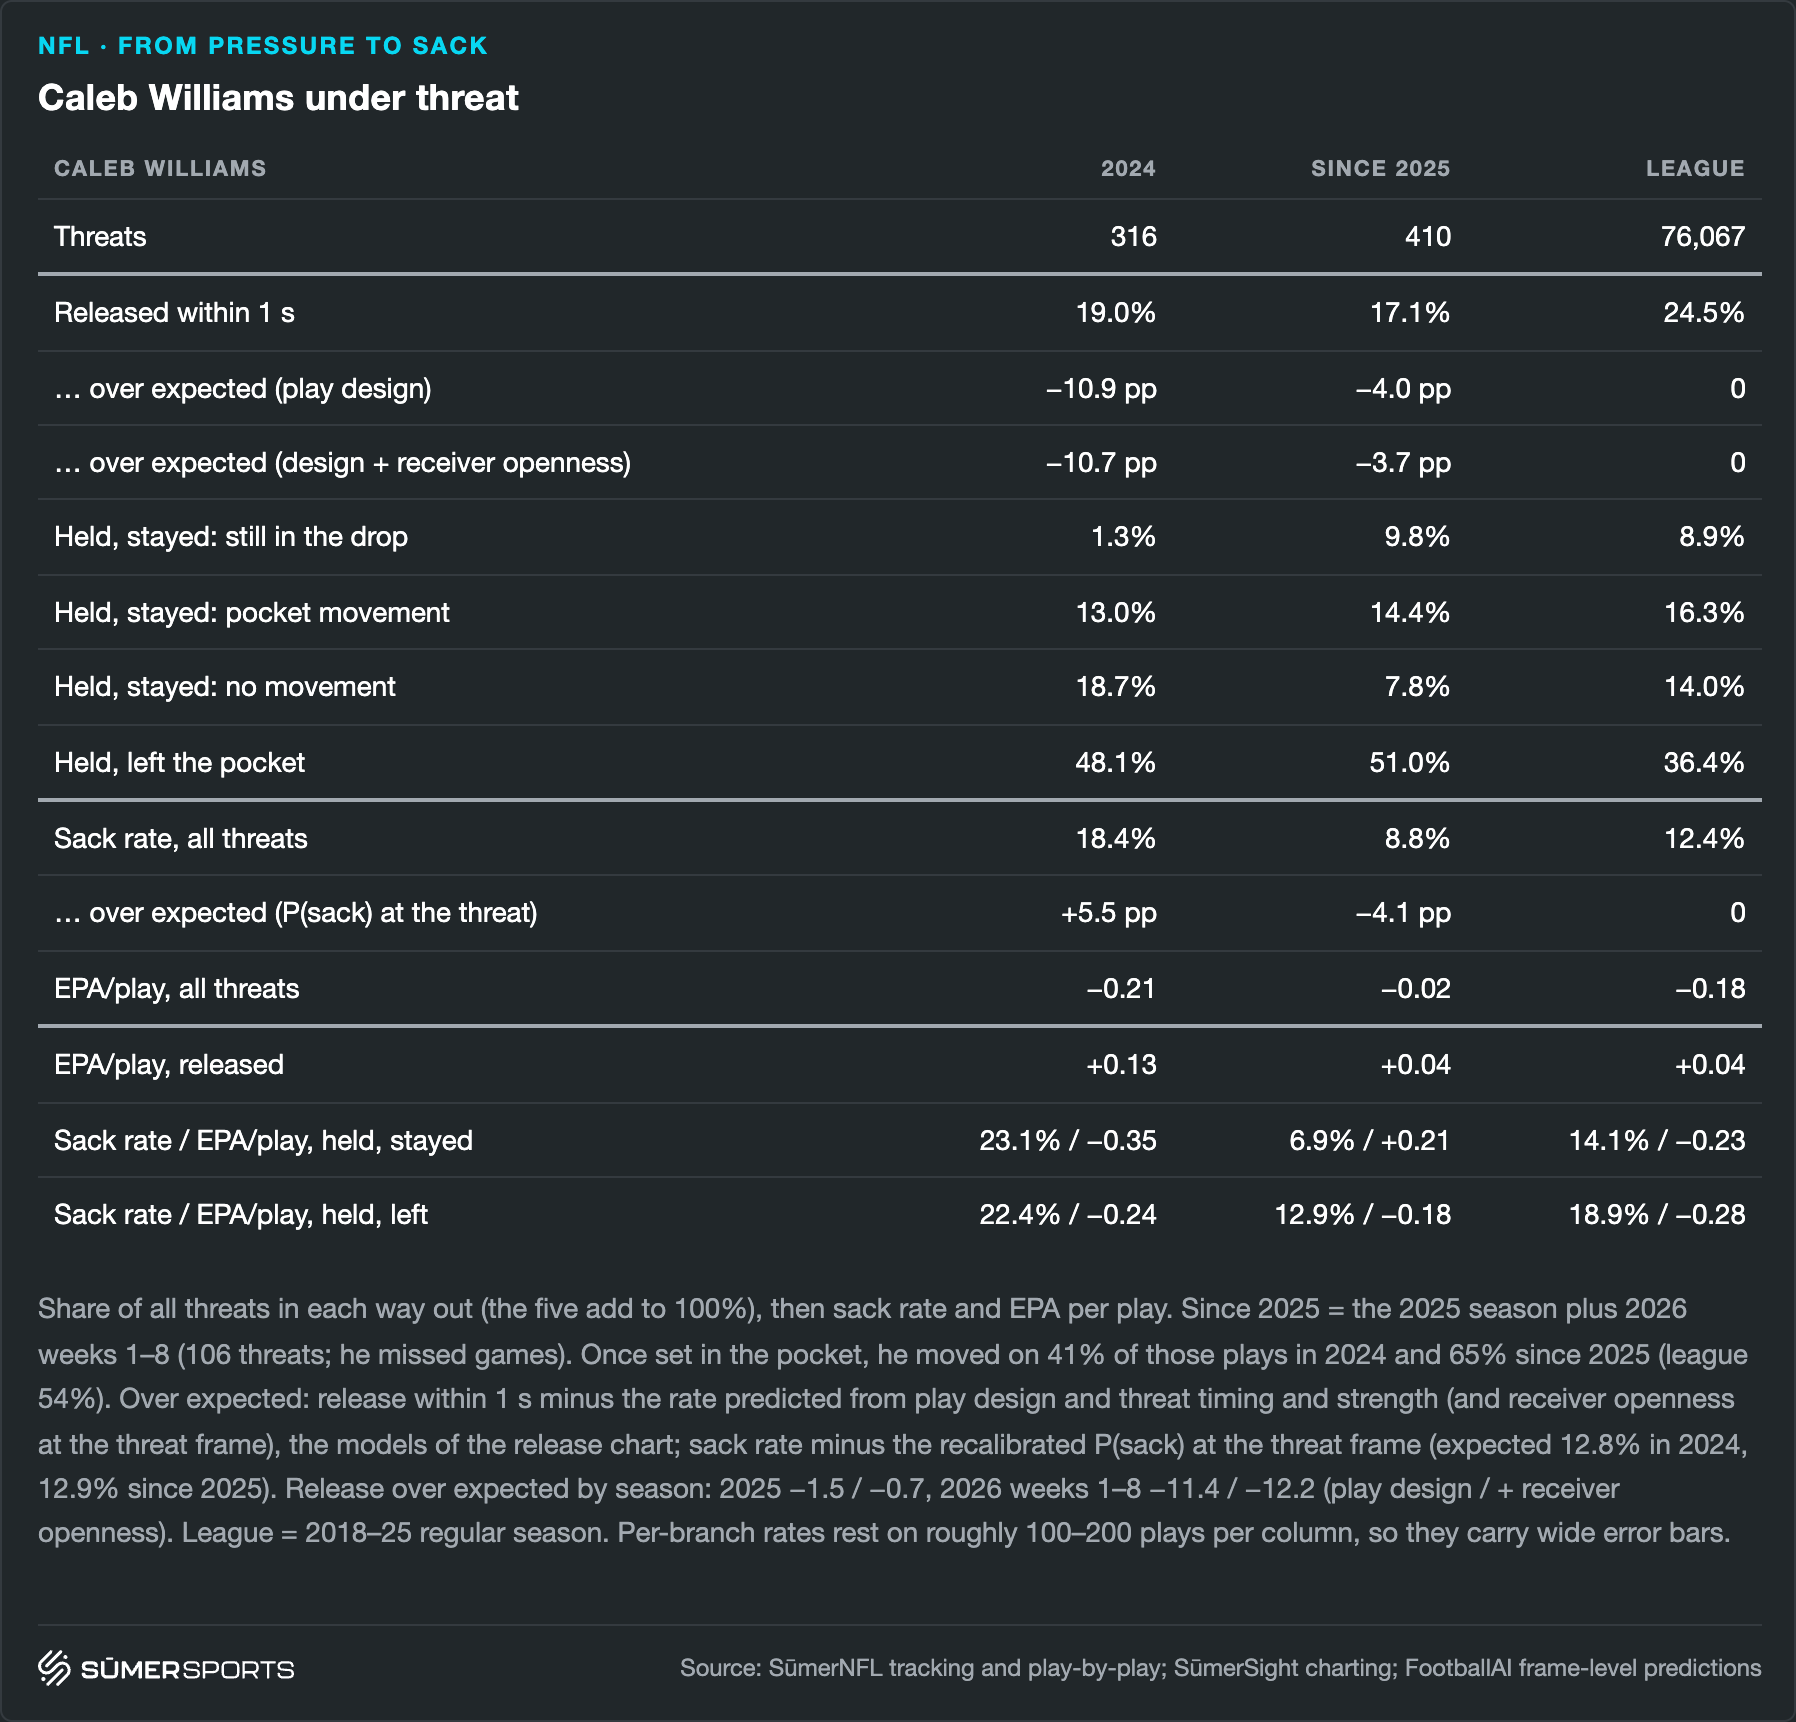
Caleb Williams is a particularly interesting case study. Here are his numbers for his rookie season and since 2025 (his second season plus 2026 so far): His general tendency of leaving the pocket sticks with him and given his athleticism outside the pocket as well as his ability to throw on the move, this makes a lot of sense. The crucial improvement: With the help of Ben Johnson and the new offensive coaching staff, he could drastically improve his pocket behavior and cut down his sack rate and improve EPA/play on threats where he stayed in the pocket. He also takes fewer sacks when leaving the pocket, because he both learned to keep his head up and find a target and also to throw the ball away when the play is just not there.
It's also notable that Ben Johnson is actually putting more on his plate than Shane Waldron in his rookie season. Based on the play design, the expected hot release rate on threats was 29.9% in Caleb's rookie season and only 21.1% since. This is Ben Johnson's tendency to hunt for big plays. Given that we learned that quarterback production when not releasing quickly is stable, this makes a lot of sense with a talented athletic quarterback like Caleb Williams.
It's also interesting that his production when quickly releasing upon a threat is even down compared to his rookie year. This is a very unstable number and given that the Bears offense is generally good, there is some reasonable hope that this number might improve a little bit going forward.
What frame-level pressure adds
With the help of frame-level pressure predictions and tracking data, we were able to do several things that weren't possible before:
- A part of the definition of pressure is "a quarterback getting rid of the ball in light of an incoming pass rusher". While there are still a lot of pressures of different natures, this makes it so that some pressured plays do not result in a sack almost by definition. With the help of frame-level analysis, we can not only identify this issue, but we can also identify those pressures and measure them before they happen and thus look at the quarterback's behavior from a perspective where the quarterback was still making his decision.
- Through defining a threat, we could dissect a quarterback's behavior against a pass rush threat and gather takeaways that match the eye test very well, but were hidden from pure play-level analysis.
- We could take another stab at measuring how well pass rushers finish successful pass rush reps into sacks. We could account for some pressures never having a chance to become a sack and also for which quarterback they are trying to sack. Nevertheless, the conventional finding that it's mostly out of the pass rusher's control is still holding up, even after accounting for how the quarterback is behaving in the same play.
Overall, these are the main takeaways from what we found:
- For pass rushers, any stability in sacks per pressure comes from the sack danger at pressure arrival, not from what he does beyond the pressure arrival in terms of finishing. As a consequence, an expected sack rate metric is a good middle ground between pressure and sack rates, since it accounts for the different danger levels of pressures without crediting too much of the noisy finishing ability to the pass rusher.
- For quarterbacks, both the sack danger at pressure arrival and the sack avoidance beyond that expectation are stable traits and we could separate the two by looking at a quarterback's reaction to a threat.
- Releasing quickly after a threat is the most efficient response and it drives low sack dangers on pressure arrival, but the skill is choosing to do it, not what happens after. After accounting for play design and receiver openness, hot release rate is the most stable metric we looked at in this article.
- The tendency of holding the ball upon a threat is also a stable trait, but most importantly a quarterback's performance when choosing to do this is also a stable quarterback trait, both inside and outside the pocket. Once he holds under a threat, his production is at least as much in his control as on a clean dropback and his sack rate is at least as much in his control as on all dropbacks.
Regarding a quarterback's performance when holding onto the ball and especially when leaving the pocket: It is notable that within a single season, the sample sizes for those are still fairly low, so our finding doesn't mean that we should trust a quarterback's production in these situations and assume it will not change. However, it means that defining and quantifying traits that make up a good quarterback within the pocket when threatened or when leaving the pocket is a very valuable task and scouting departments that can dissect those traits on film could gain an edge.