Being the kickoff of the draft season, the NFL Combine swirls up intrigue and fuels heated debates as outsiders finally get the chance to receive a first look at the year’s draft class.
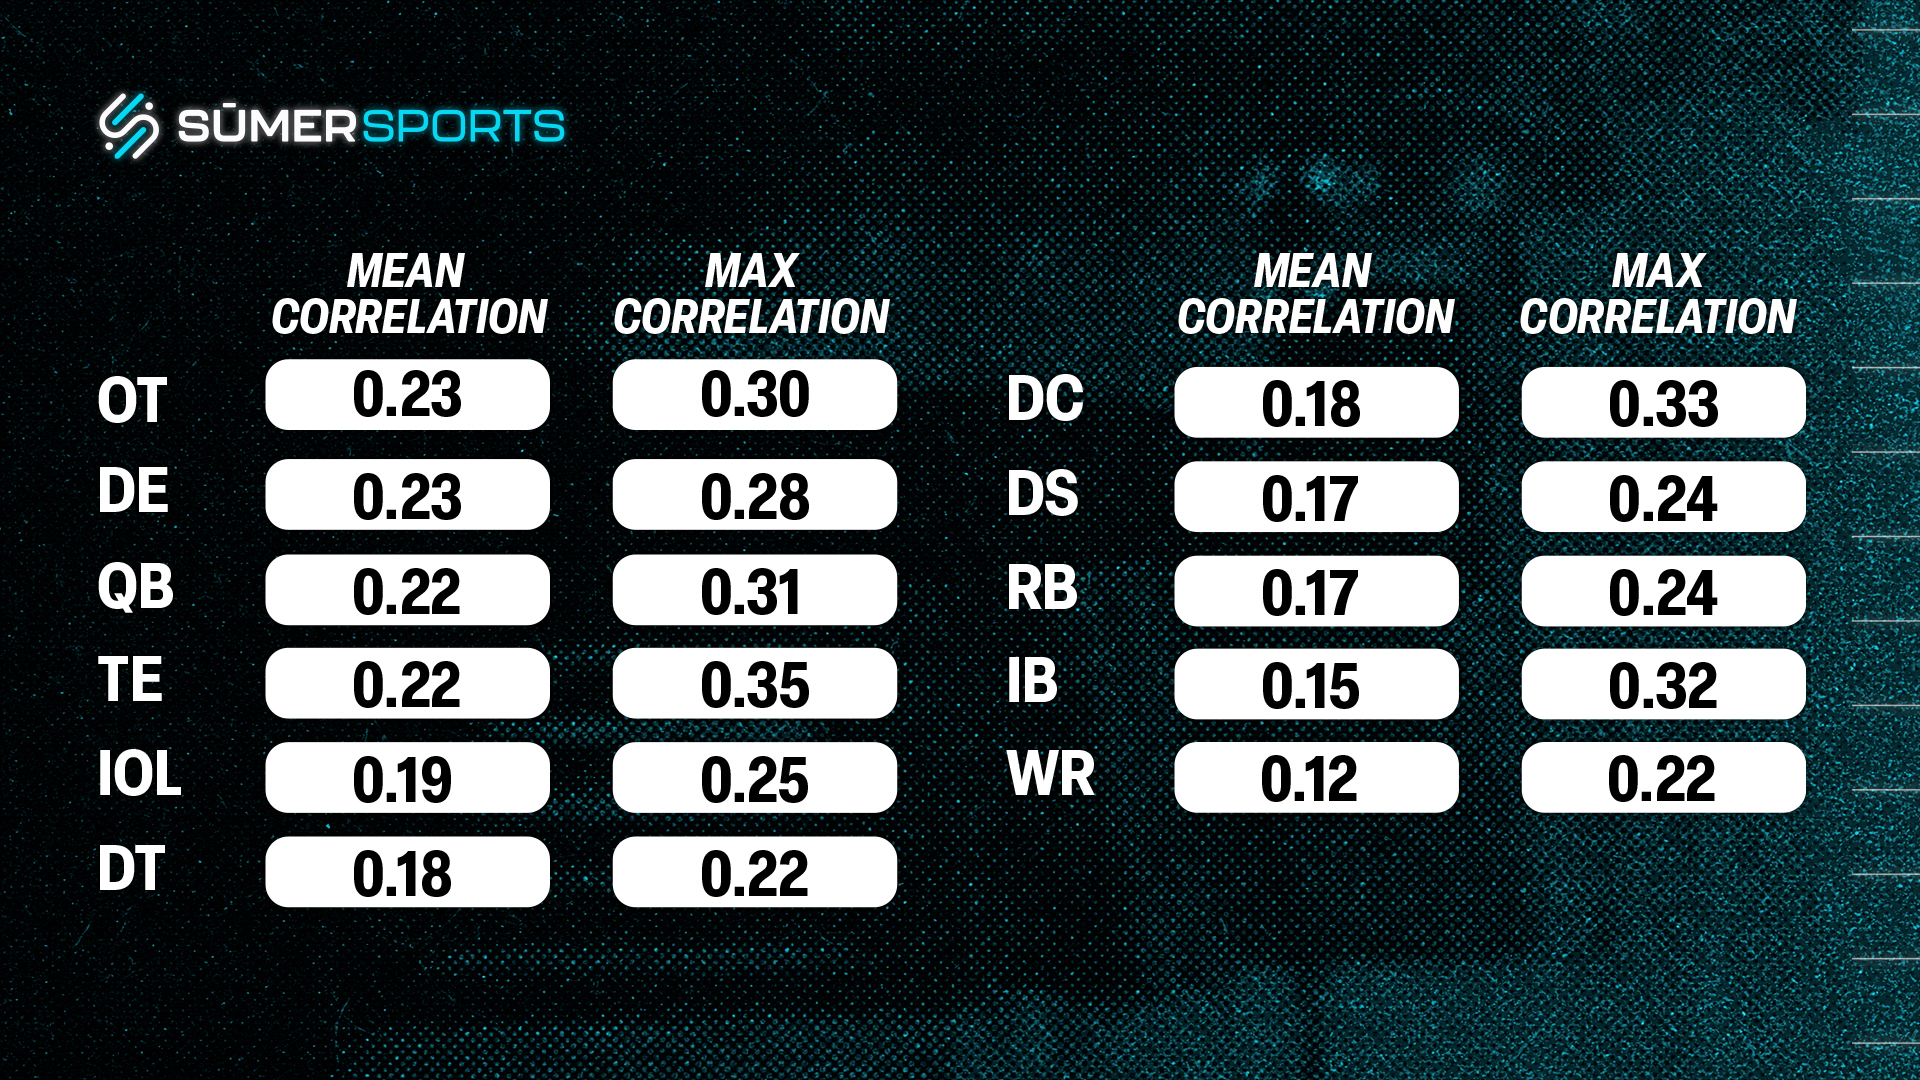
Though the Combine is a massive media spectacle, statistically, it fails to live up to the hype in terms of its predictiveness of future NFL success. Using correlation coefficients, a 0 to 1 metric in which 1 represents a perfect relationship between an athletic test and future NFL success and 0 represents no relationship, only 5 of the 11 position groups have a maximum coefficient near 0.30. In statistical circles, 0.60 is considered the minimum to really start to believe in a relationship.
That being said, given the general complexity of drafting, the annual nature of the Combine leading to easy comparison, and the general scattershot landscape of college football (which trickles down to data availability), the Combine remains the most cohesive sets of data with respect to college-to-pro projection even in the age of analytics.
Here are the major takeaways:
- The Big Skill positions (linebackers and tight ends) have drills which provide a ton of predictiveness.
- Of the flashy, speedy skill positions, you can mostly ignore wide receivers while focusing on cornerbacks.
- Special attention should be paid to offensive linemen drills - the position may not have the highest maximum coefficients, but the Combine is amongst the deepest and most controlled sources of data for college-to-pro evaluation.
Quarterback Combine Drills
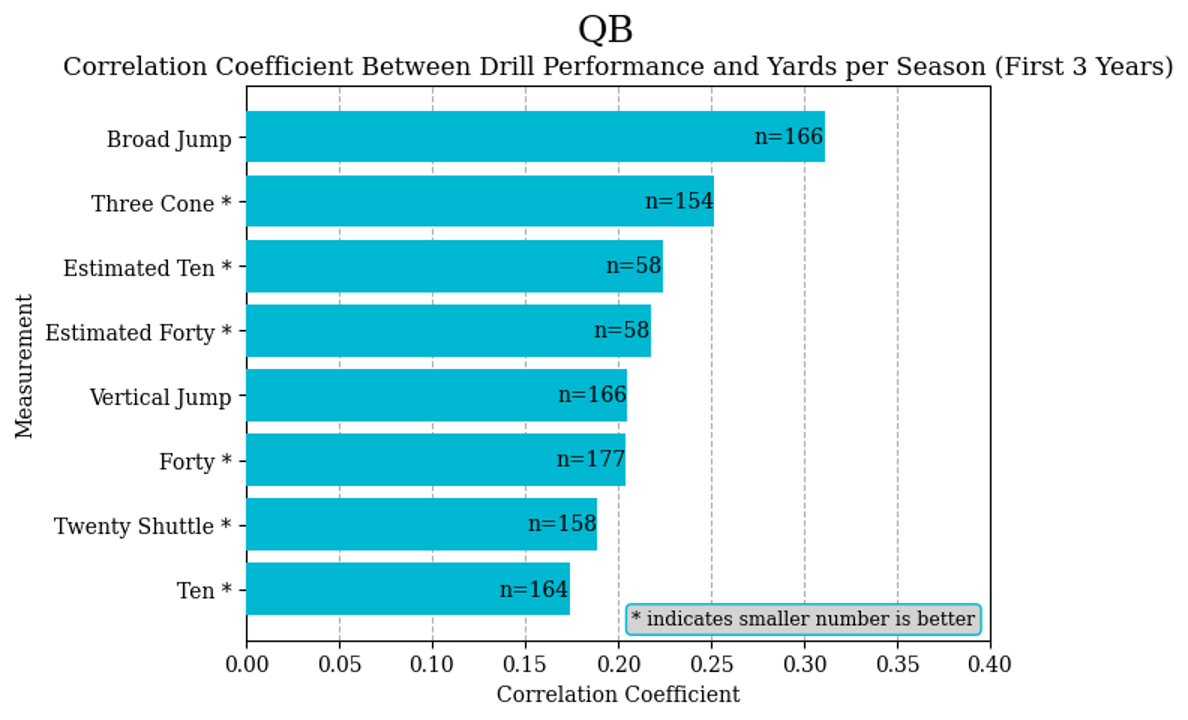
Likely because a quarterback’s success varies greatly based on mental acuity in live game play, quarterbacks do not see hefty correlations between their Combine performance and their yards per season. Only the broad jump comes near the 0.30 correlation coefficient threshold. Top performers in the broad jump include high performers such as Cam Newton, Jalen Hurts, Andrew Luck, Geno Smith, and Justin Herbert.
Running Back Combine Drills
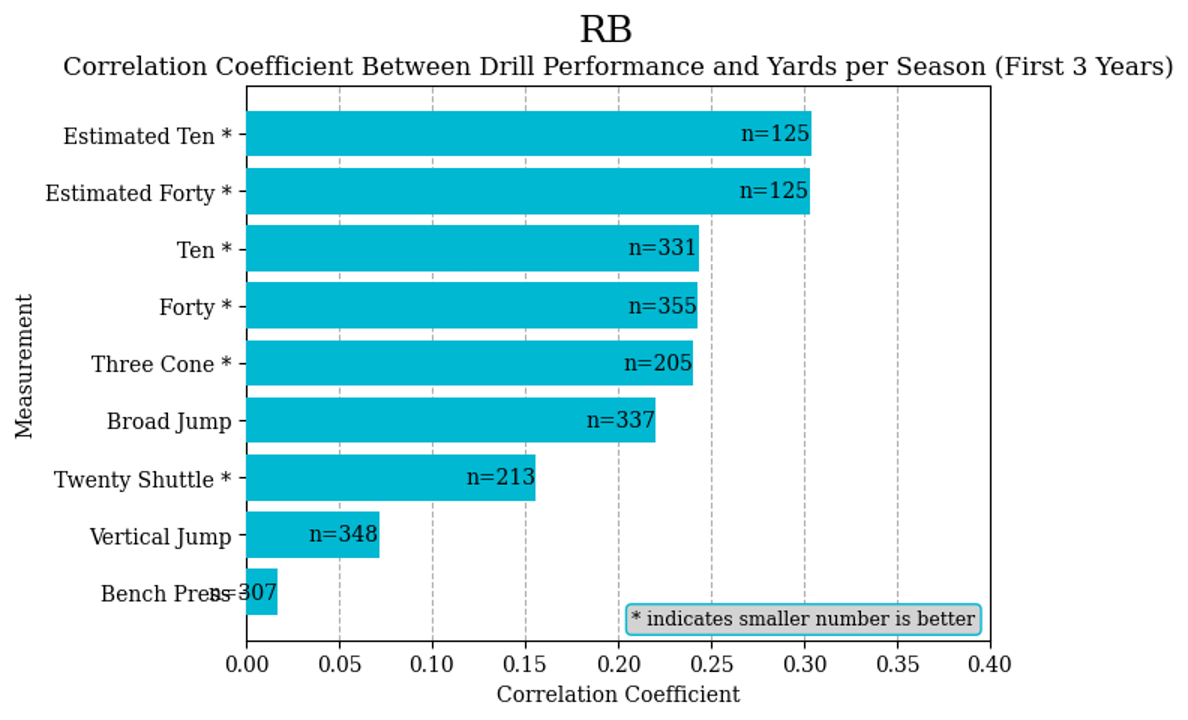
The running back position has no athletic tests at the Combine that meet the 0.30 correlation coefficient threshold of interest. However, estimated speed tests based on college tracking data are slightly over 0.30. Running backs typically hit top speed on long, explosive runs. So, while top game speed likely does have a positive correlation with a player’s performance at the next level, this is likely also capturing a running back’s ability to generate explosive runs. Keaton Mitchell and James Cook are both in the top 3 of the estimated forty rankings in the sample size shown above. A major name to watch at the Combine given his estimated forty is Nicholas Singleton (Consensus Big Board 60). Singleton’s estimated forty was in the top 10 of the class in both 2024 and 2025. You can learn more about Nicholas Singleton on The Evaluation.
Wide Receiver Combine Drills
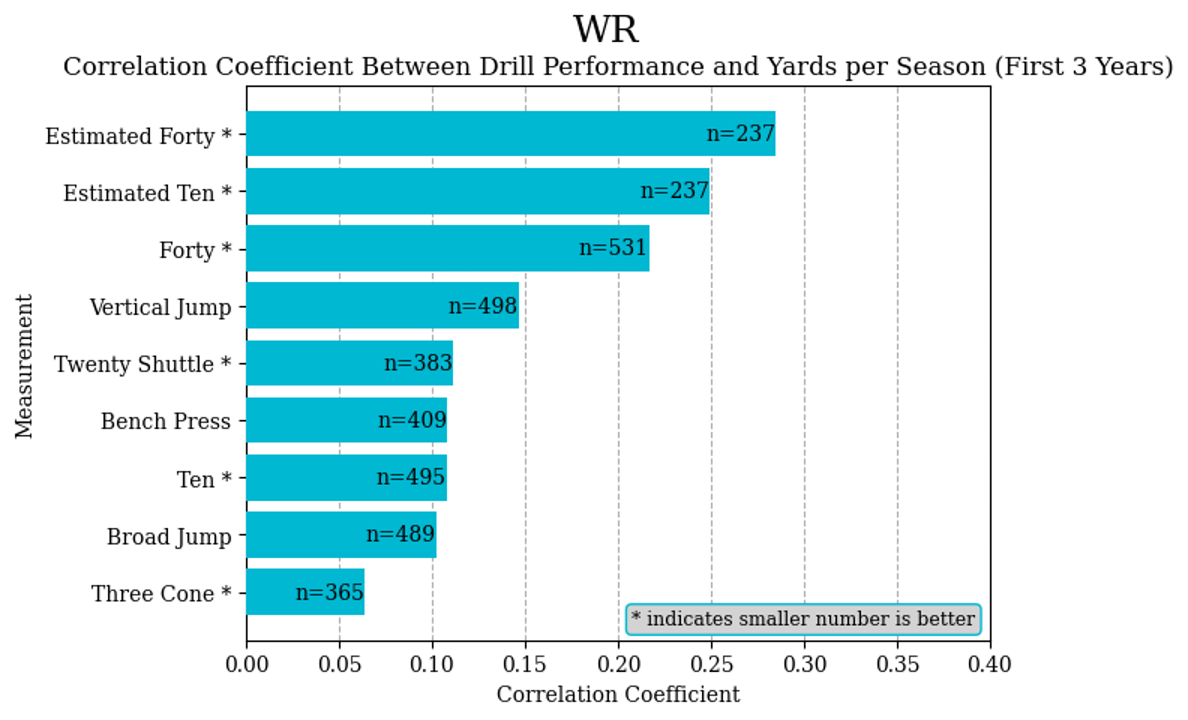
There are also no tests or estimations of tests that meet the 0.30 correlation coefficient of interest for wideouts. Despite many of the top forty-yard dash performances coming from wide receivers (John Ross and Marquise Goodwin, for example), there are only two receivers in the top 15 of the sample (Mike Wallace and Brandin Cooks) who accumulated even remotely close to 1,000 yards per season (1,068 yards and 953 yards, respectively). From these correlations, it is clear that athletic testing does not quite capture what it takes to succeed in the NFL at wide receiver. If you want to glean anything from wide receivers, pay more attention to the tracking speed readings during the gauntlet -- in which the receivers are attempting to run full speed while also making multiple catches -- than to the actual forty-yard dash.
Tight End Combine Drills
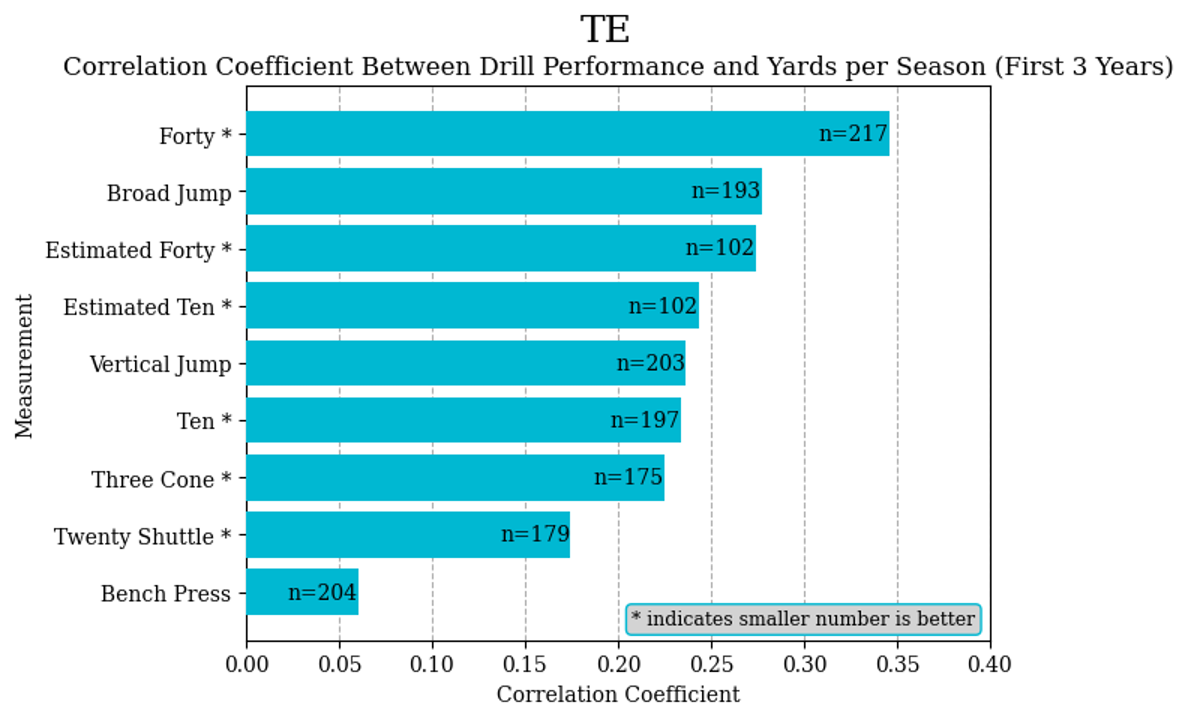
In contrast, the coefficient for the forty-yard dash for tight ends nearly crosses 0.35 for tight ends’ receiving yards per season. While this is partially due to a lower ceiling of receiving yards for tight ends as a position group, players such as Evan Engram, Darren Waller, Jared Cook, Noah Fant, George Kittle, Mike Gesicki, and Jimmy Graham are all in the top 20 of the sample. A massive name to watch for the 2026 Combine, should he run, is Kenyon Sadiq from the University of Oregon. Sadiq has a blue chip estimated forty based on his 2025 on-field performances.
Offensive Tackle Combine Drills
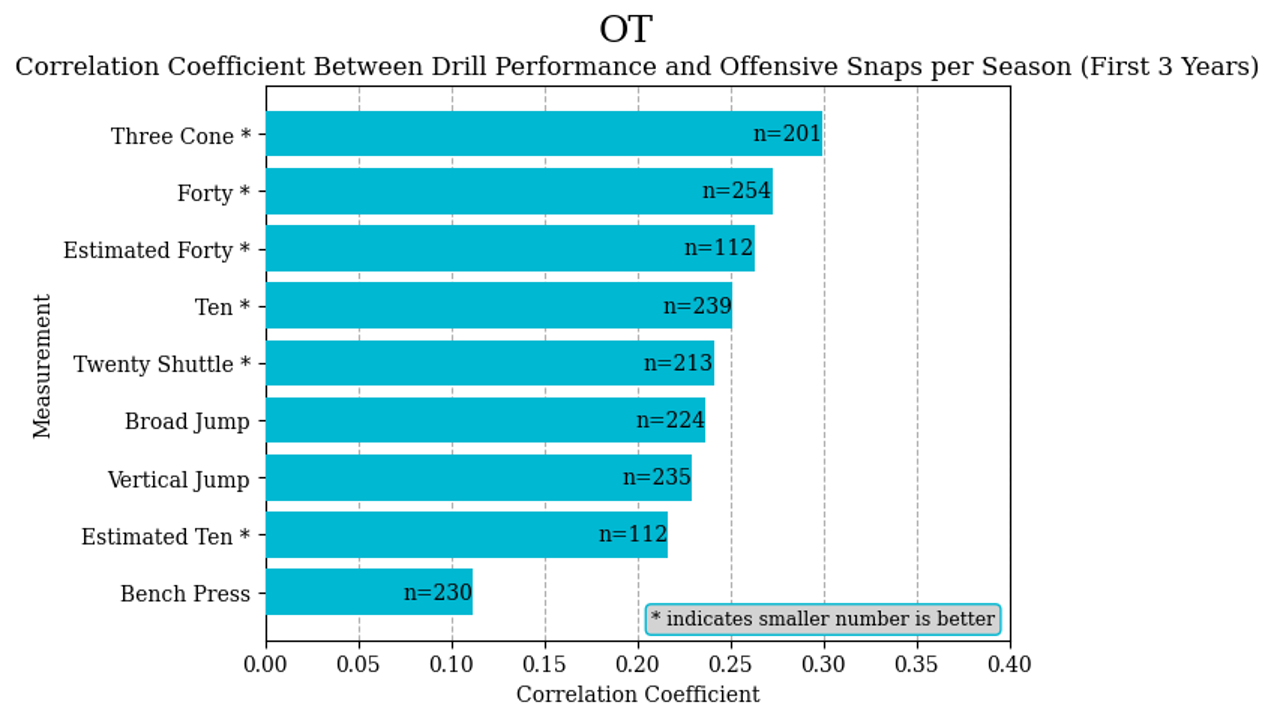
When it comes to offensive lineman, the Combine has a strange importance. Despite not having the strongest correlations of all position groups, the drills for the most part are consistently above the 0.20 coefficient mark. At the same time, data is so scarce on offensive linemen that the Combine tests are perhaps the deepest and most consistent source of evaluation we have. As a result, despite not technically crossing the 0.30 coefficient threshold, drills like the three-cone and the forty-yard dash can be helpful in evaluating tackles. For example, the top 10 of the three-cone includes standouts such as Brian O’Neill, Garrett Bolles, Dion Dawkins, and Lane Johnson.
Interior Offensive Linemen Combine Drills
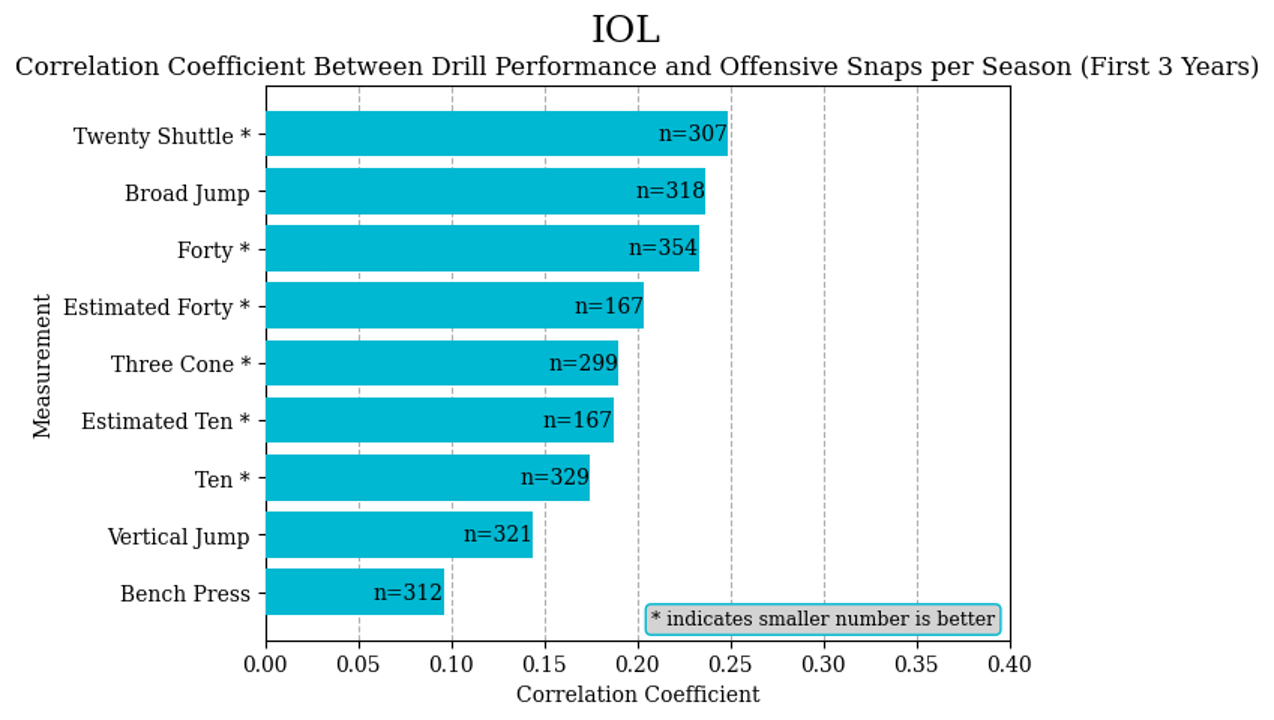
Interior offensive line tests have lower maximum correlations than tackles but generally follow the same story. The twenty-yard shuttle is the most correlative test, and top performers include Jason Kelce, James Daniels, and J.R. Sweezy.
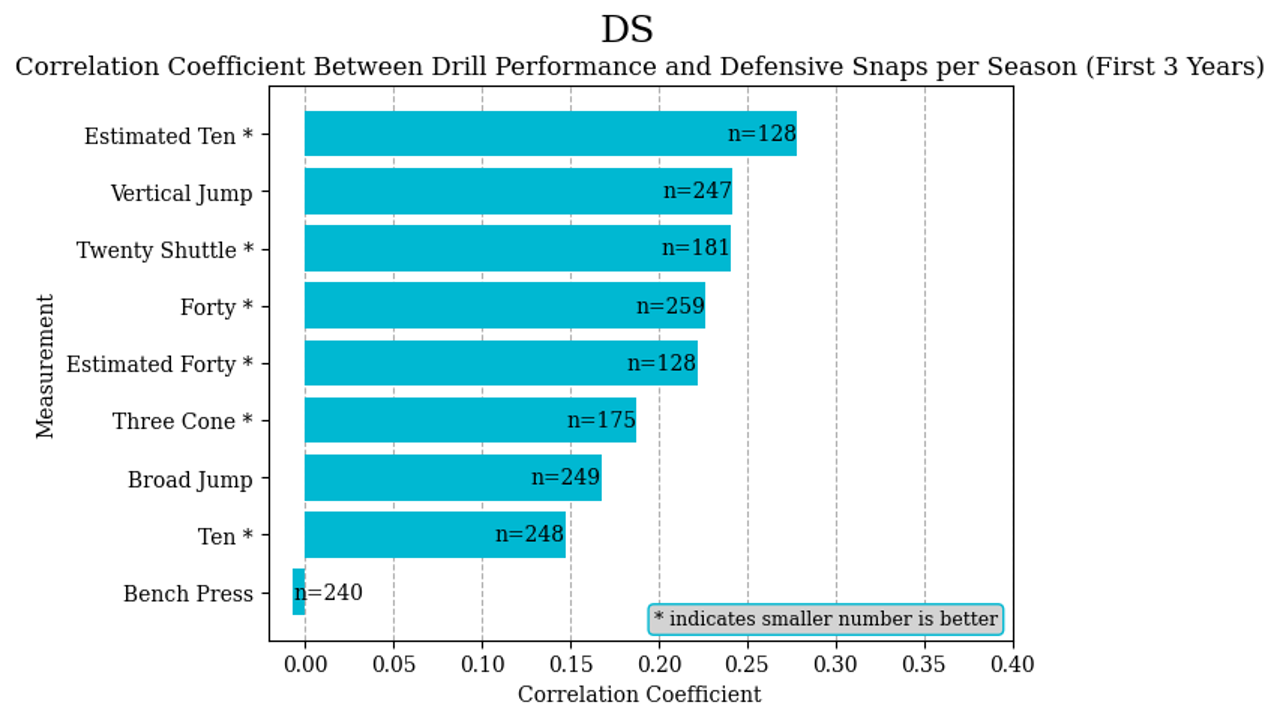
Defensive End Combine Drills
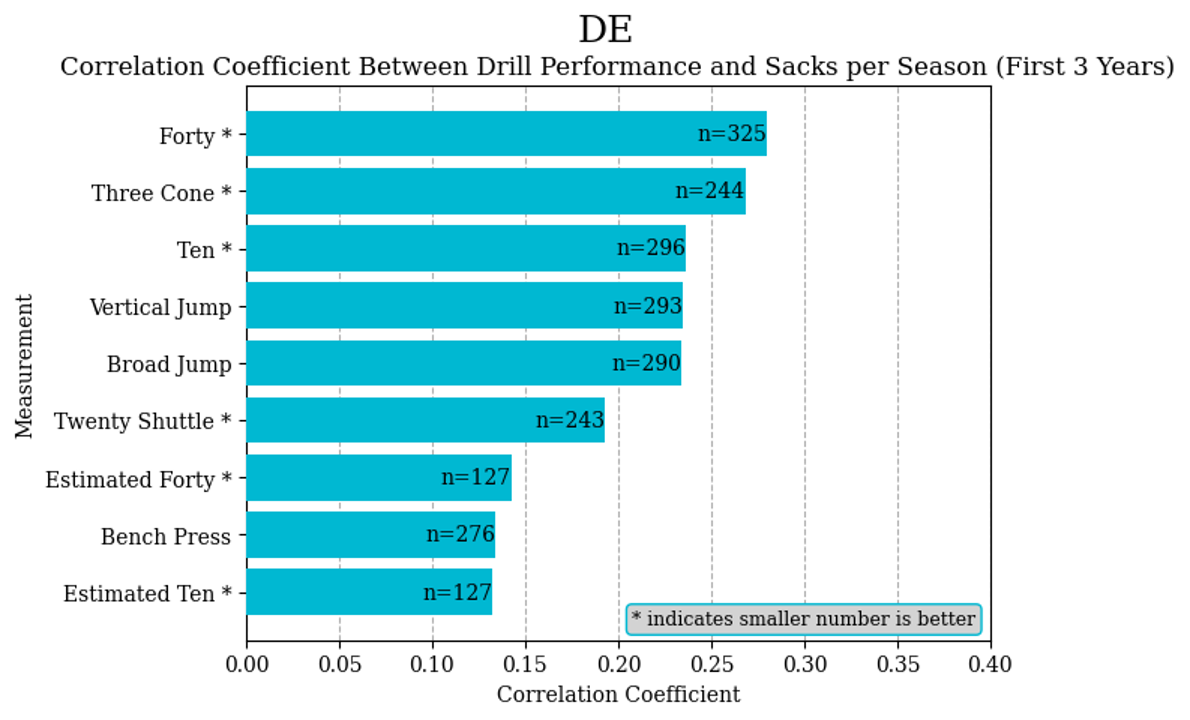
The defensive positions act as a mirror to the offensive positions, with the “bigs” often not seeing super high maximum correlations, but stronger relative coefficients across the board. That is the case with defensive ends. Interestingly, the forty-yard dash is more correlated with sacks per season than the ten-yard split, which in theory should better gauge “Get Off Ability”. Top performers in the forty include Montez Sweat, Cliff Avril, Travon Walker, Vic Beasley, Brian Burns, and Jadeveon Clowney.
Defensive Tackle Combine Drills
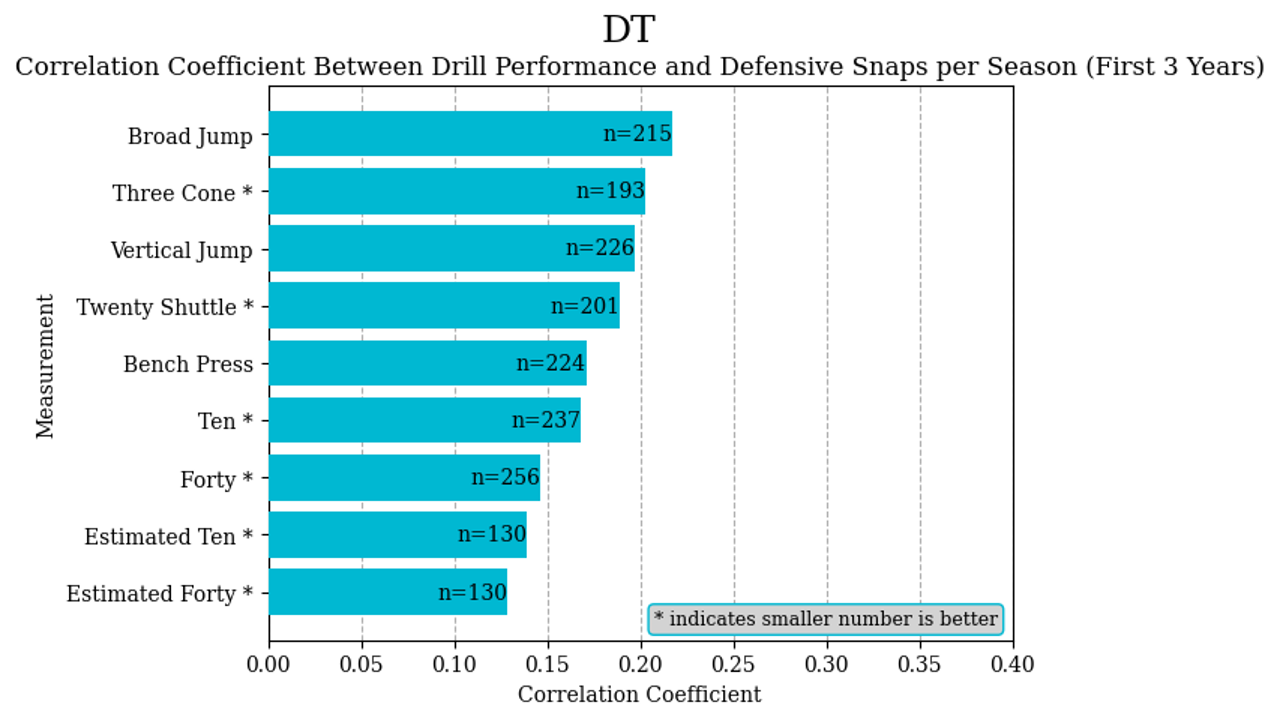
Defensive tackles, who have a variety of roles and associated body sizes, see amongst the lowest correlations. Even defining the target variable (in this case, Average Snaps in the first 3 seasons) is difficult, given some tackles are 300-pound-plus run stuffers who play only on early downs while others are 260 to 270-pound pass rush specialists who typically play on later downs.
Inside Linebacker Combine Drills
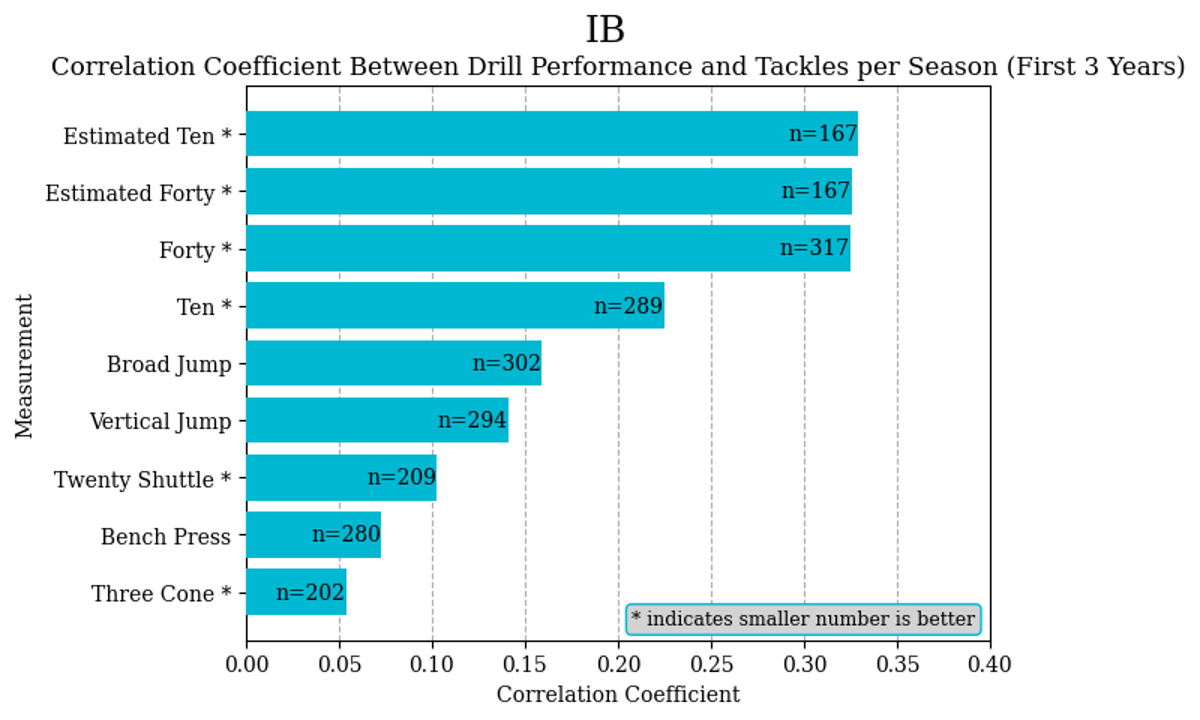
Inside backers mirror their dual-role partners, tight ends. Most straight-line speed tests and estimations cross the 0.3 coefficient threshold of interest. It is possible that the estimations are also capturing a backers’ coverage ability, pursuit skills, and effort, given that plays that utilize those traits often involve the player hitting top speeds. Top historical performers in the Forty include Devin White, Devin Bush, Patrick Queen, Blake Cashman, Wesley Woodyard, and Roquan Smith. University of Georgia linebacker CJ Allen, who is currently 28th on the Consensus Big Board, is a player to watch here, as he has the fourth fastest estimated forty-yard dash of 4.57.
Cornerback Combine Drills
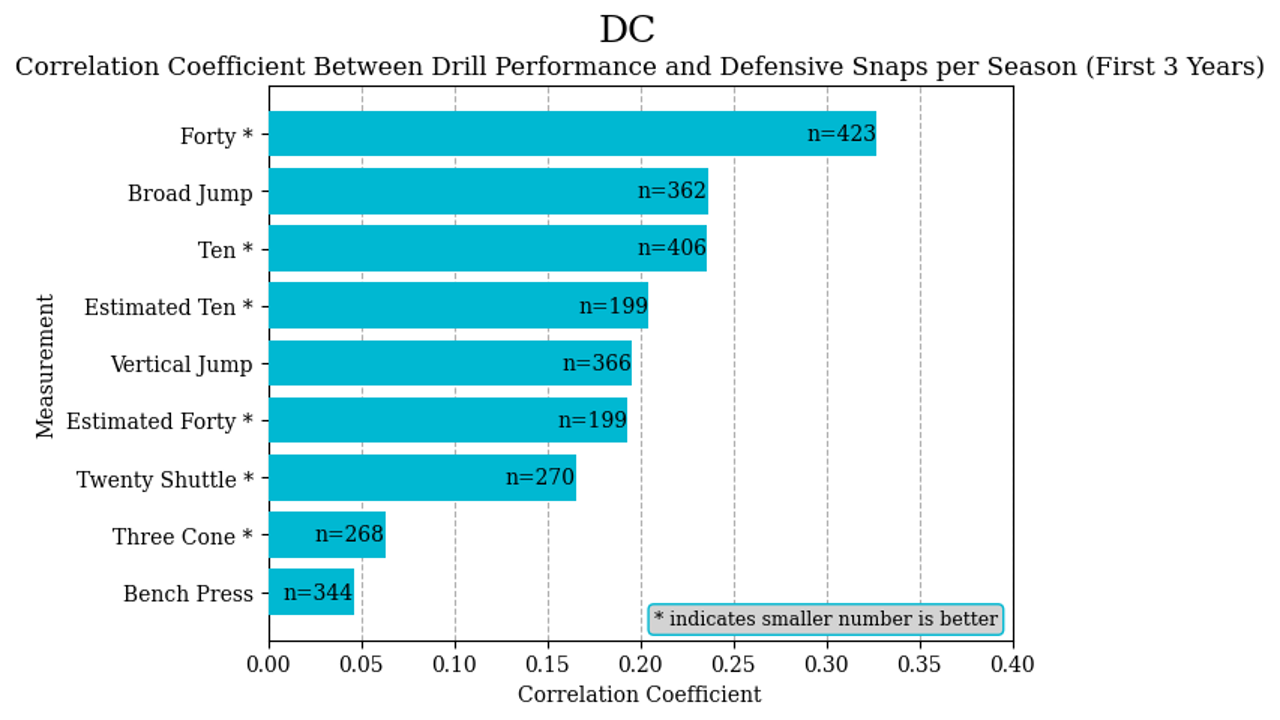
Surprisingly as compared to wide receivers, cornerbacks actually have a high correlation between snaps per season in the first 3 years and forty speed. Given this is not a perfect success metric for the notoriously hard to evaluate corner position and NFL decision makers may be inherently more biased towards speedy corners, take this result with a grain of salt. Nonetheless, impact performers such as Tariq Woolen, Jamel Dean, Denzel Ward, and Dominique Rodgers-Cromartie were top performers in this test. A name to watch with respect to their Forty is Keionte Scott out of the University of Miami (Consensus Big Board 51), who has the second-best estimated forty-yard dash in the draft class.
Safety Combine Drills
For safeties, who have a diversity of roles, body types, and assignments alongside being generally harder to evaluate, no tests cross even the 0.25 coefficient threshold. The closest metric to being relevant is our tracking-based estimation of the ten-yard split. Dillon Thieneman from University of Oregon (Consensus Big Board 33) is the sixth-best performer of the draft class in this metric.
The Combine is More Than Just Numbers, Though.
While the relative correlations within each position group can help focus attention during the drills, it cannot be restated enough that all of these correlations indicate a weak relationship with success at the NFL level. Perhaps this is why teams like the Rams and Jaguars do not send their leadership to the Combine.
That is not to say the combine is without value. The athletic tests are only one small part of the Combine experience. Seasoned evaluators document more detailed items such as shin angles on the sprints, movement ease for the linemen drills, and arm mechanics for the quarterbacks. As technology progresses, analytics should be able to better capture these detailed elements. In addition, interviews and medical examinations are conducted, two crucial items of information for a prospect projection.
And that says nothing of the excellent fan experience and media spectacle, in which narratives are formed, information is swapped, and hopes are generated regarding the next batch of NFL stars.
Methodology
The correlation research tracks athletic tests and on-field performances from the 2008 draft class to the 2022 draft class. Estimated tests include available data from the 2019 (the first year that college tracking data is available) to the 2022 draft class. Counting and participation statistics were used as target variables in order to increase historical sample size and a three-year sample size for season averages was due to contract extensions generally being offered to players after their third year. A 0.30 correlation coefficient is used as a soft threshold to “care about a drill”. Especially given the weakness of a 0.30 correlation, this threshold is largely arbitrary but generally represents a centered value for maximum coefficients within position groups.


